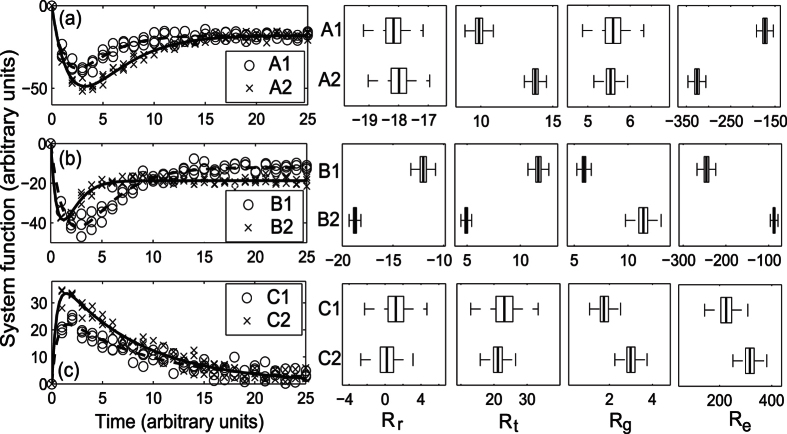
Figure 4.
Synthetic data and simulated, fitted responses based on the three pairs of responses shown in Fig. 1 (a–c) along with values of degree of return (Rr), return time (Rt), rate of return (Rg) and efficiency (Re) estimated from these fitted responses. Boxplots show the median (central mark), interquartile range (box) and range (whiskers) with outliers excluded.

