Figure 6.

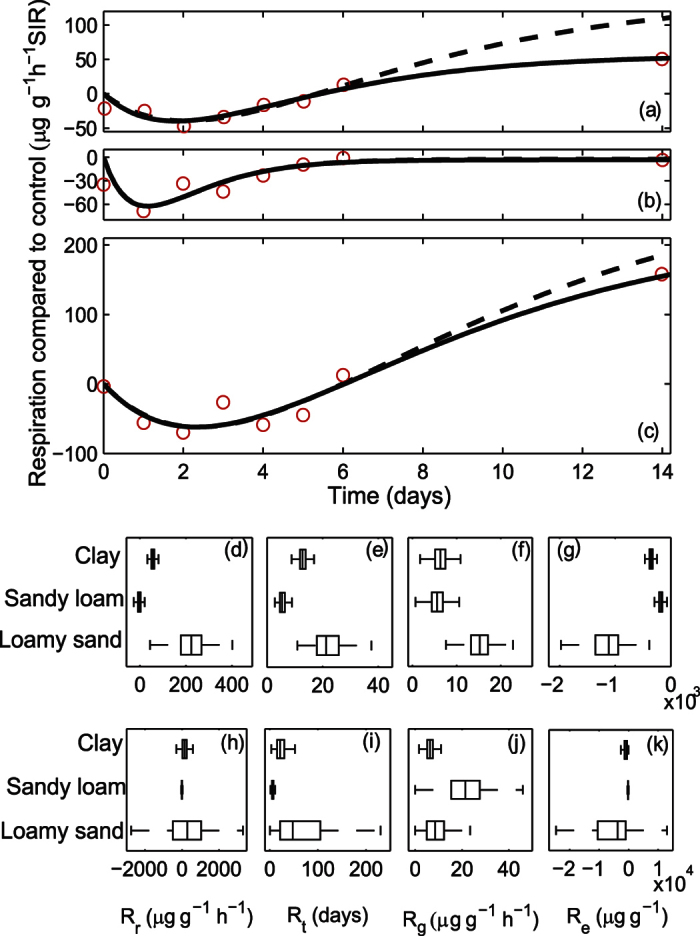
Change in substrate induced respiration of (a) clay, (b) sandy loam and (c) loamy sand soil samples after the addition of 1000 mg triclosan kg−1 dry mass showing data (circles) and the modelled response fitted either with (solid lines) or without (dashed lines) the last data point. Note that the two modelled responses are almost identical in the sandy loam. Measurements are the difference in SIR (glucose substrate) between a perturbed and a control sample, with each measurement made destructively. The resilience characteristics (Table 1) identified using the model fitted to all the data (d–g) and the model fitted without the last data point (h–k). Boxplots show the median (central mark), interquartile range (box) and range (whiskers) with outliers excluded.
