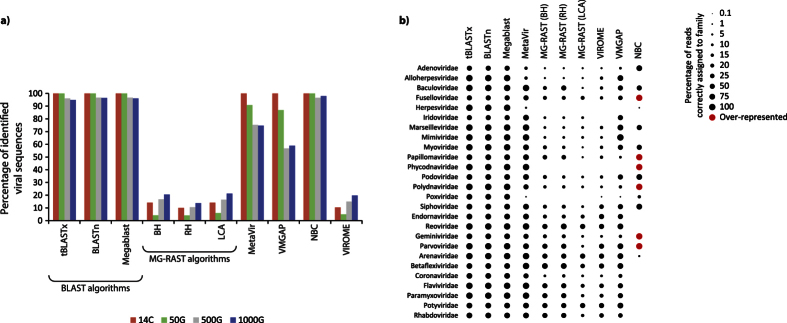
Figure 1.
(a) Percentage of viral sequences identified in the simulated viromes characterized by a different number of genomes by the different bioinformatic tools. 14C: 14 genomes of Circoviridae; 50G: randomly-sampled genomes; 500G: 500 randomly-sampled genomes; 1000G: 1000 randomly-sampled genomes; (b) Percentage of viral sequences correctly identified in the simulated viromes for each viral family. Red dots indicate overrepresented viral families (false positives).

