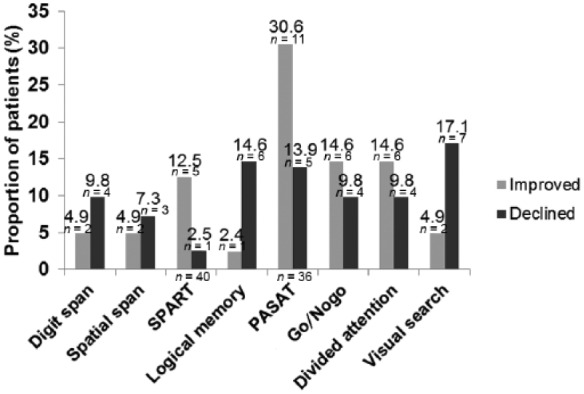
Figure 1.

Proportion of improved (i.e. exceeding the 95% interval) and declined (i.e. falling outside the lower limit of the 5% interval) patients for the different tests (12-month follow up). The whole sample was considered (n = 41), except for SPART (one missing, because this test was included in the protocol after the first patient was examined) and PASAT (five missing due to exclusion of patients having to do the test again). The proportion of stable patients is not depicted.
