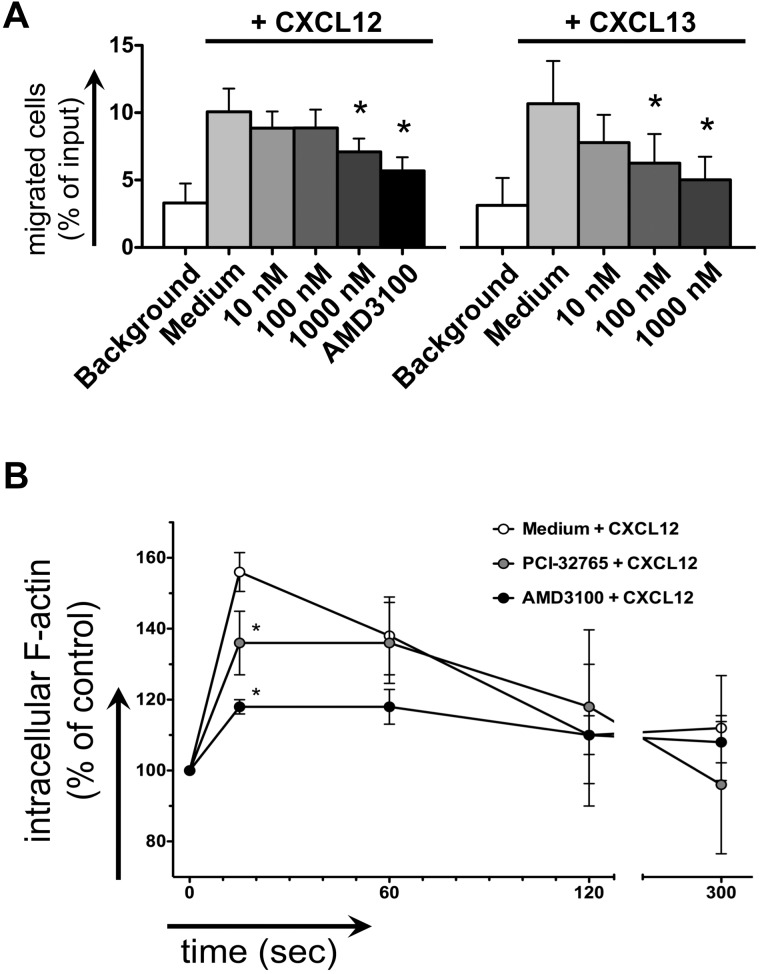
Figure 4.
Inhibition of CLL cell chemotaxis and actin polymerization. (A) Displayed is the mean ± SEM relative migration of CLL cells from 8 different patients toward CXCL12 (left graph) and CXCL13 (right graph) in the presence or absence (medium control) of different concentrations of PCI-32765, as indicated on the horizontal axes. White bars depict background migration toward wells without chemokine. (B) Displayed is the relative F actin content of CLL cells after stimulation with CXCL12 staining with FITC-labeled phalloidin in the presence or absence of PCI-32765 (or AMD3100 as control) at the time points indicated on the horizontal axis. * indicates P ≤ .05 compared with the control with chemokine; medium.

