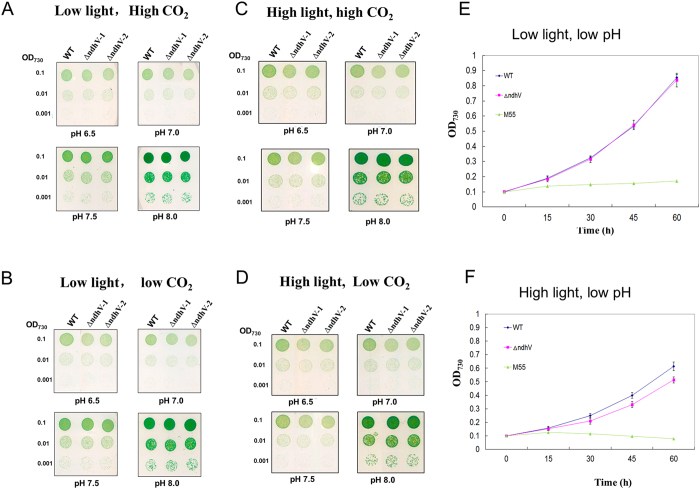
Figure 2. The growth phenotype of WT and ΔndhV strains.
(A–D) Five microliters of the cell suspensions with the OD730 nm values of 0.1, 0.01, and 0.001 were spotted on agar plates containing BG11 buffer at different pHs and grown at a low light (40 μmol photons m−2 s−1), high CO2 (3% v/v) (A); low light, low CO2 (0.04% v/v) (B); high light (300 μmol photons m−2 s−1) and high CO2 (C); ligh light and low CO2 (D) for five days. (E,F) Cell density of WT, ΔndhV , and M55 strains were measured at different times after grown at low light (40 μmol photons m−2 s−1) and low pH (pH 6.5) (E), or high light (300 μmol photons m−2 s−1) and low pH (pH6.5) (F), 2% CO2 (v/v in air). Values are means ± SD (n = 3). Values are means ± SD (n = 3).

