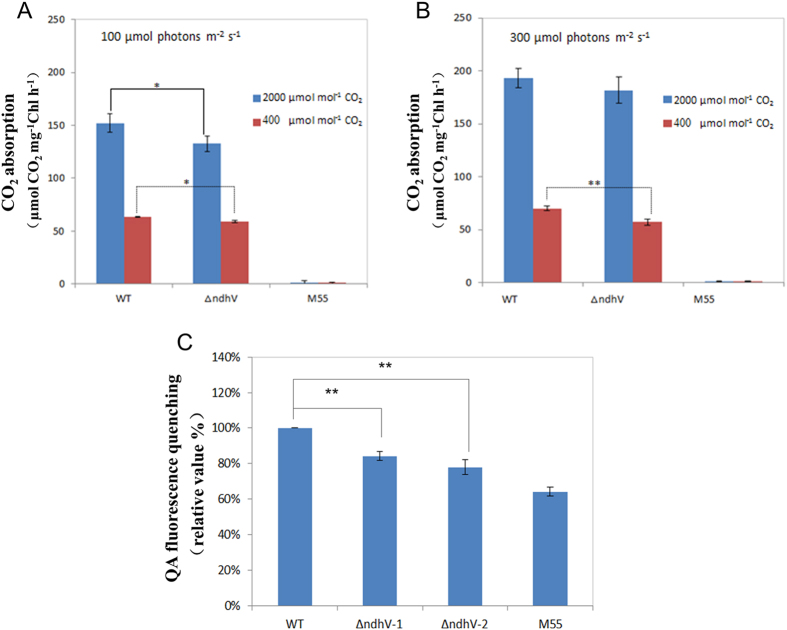
Figure 3. Comparison of the CO2 uptake and the proton gradient across thylakoid membranes between WT and ΔndhV strains.
(A,B) The rate of CO2 uptake in WT, ΔndhV and M55 strains at 100 μmol photons m−2 s−1 (A) or at 300 μmol photons m−2 s−1 (B). The cells of WT and mutant strains were harvested at mid-logarithmic phase (OD730 ≈ 0.5) and chlorophyll a concentration was adjusted to 400 μg ml−1. 30 μl of the cell suspensions were placed on the BG-11 agar plate. The activity of CO2 uptake was measured at 30 °C. The CO2 concentration was controlled at 400 or 2000 μmol mol−1. Values are means ± SE of three independent measurements. Asterisk indicates significant differences (t-test, *P < 0.05 and **P < 0.01). (C) Analysis of proton gradient across thylakoid membranes using QA (quinacrine) fluorescence quenching in WT, ΔndhV and M55 strains. Intact cells of WT and mutant strains were harvested at mid-logarithmic phase (OD730≈0.5) and then suspended at a final chlorophyll a concentration of 150 μg ml−1 in a reaction medium contained 5 mM Tris/MES (pH 8.0), 0.3 M mannitol, 2 mM DTT, 5 mM D-Glucose, 1.5 mM ATP, 5 μM quinacridine. The quenching of QA fluorescence was induced by adding the cells sample to 2 ml reaction mixture after the background fluorescence reached steady state about 2 min after started the measurement. The QA fluorescence quenching of WT is 5.02%. Values are means ± SE of three independent measurements. Asterisk indicates significant differences (t-test, *P < 0.05 and **P < 0.01).

