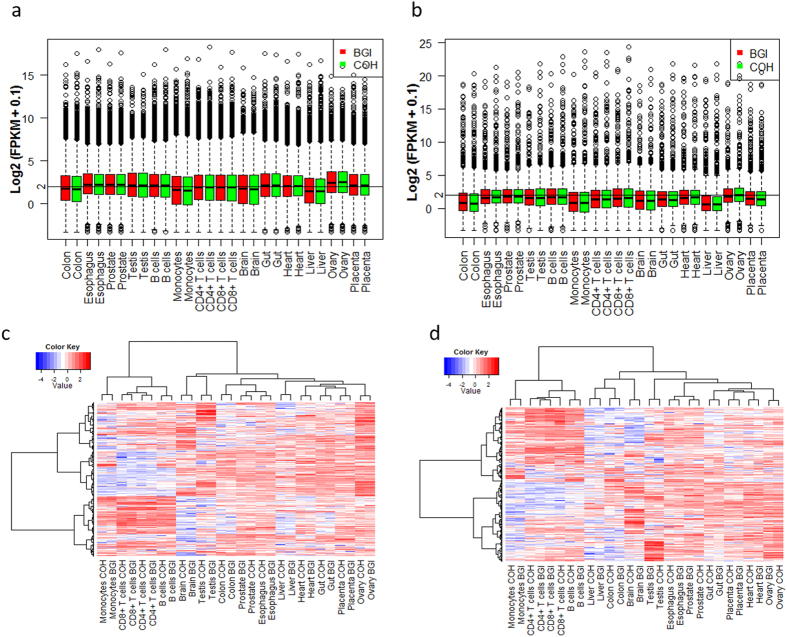
Figure 4. Overview of expression profiles of protein-coding and noncoding transcripts in 14 human tissues.
Boxplots show the overview of expression profiles of protein-coding (a) and noncoding (b) transcripts in 14 human tissues. X axis is the samples. Red and green boxes represent samples sequenced at BGI and COH, respectively. Y axis is the log2 (FPKM + 0.1) values. Hierarchical clustering analysis based on protein-coding (c) and noncoding (d) transcripts groups tissues of similar nature together. The intensity of the color scheme is scaled to the log2 (FPKM + 0.1) expression values that are Z-score standardized per transcript in (c,d), and blue and red represent low and high expression levels, respectively.

