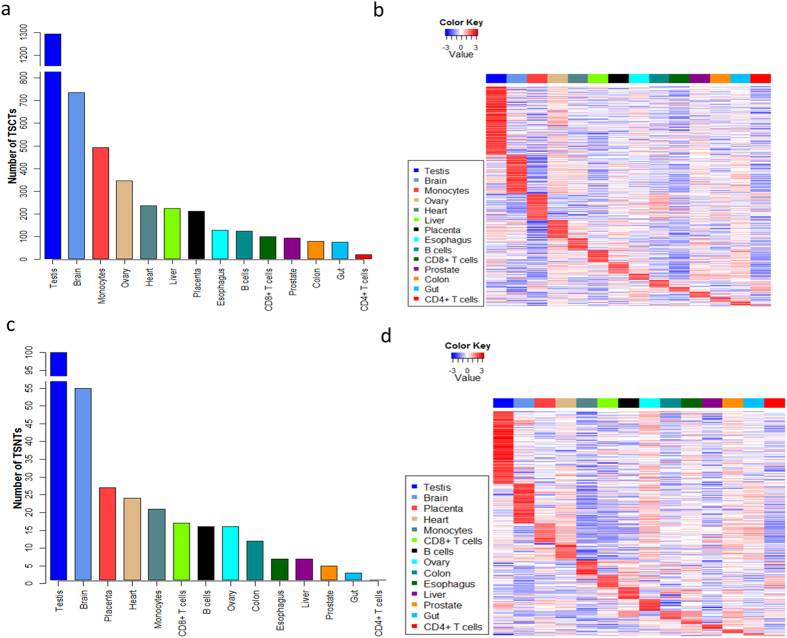
Figure 5. Expression profiles of TSCTs and TSNTs.
(a) Number of TSCTs based on FC ≥ 2. X-aixs is the tissue type and Y-axis is the number of TSCTs. (b) Expression profiles of TSCTs. Red indicates higher expression, and blue indicates lower expression. (c) Number of TSNTs based on FC ≥ 2. (d) Expression profiles of TSNTs. Expression data are Z-score standardized per transcripts in (b,d). Tissue specific analysis was based on the log2 (FPKM + 0.1) values.

