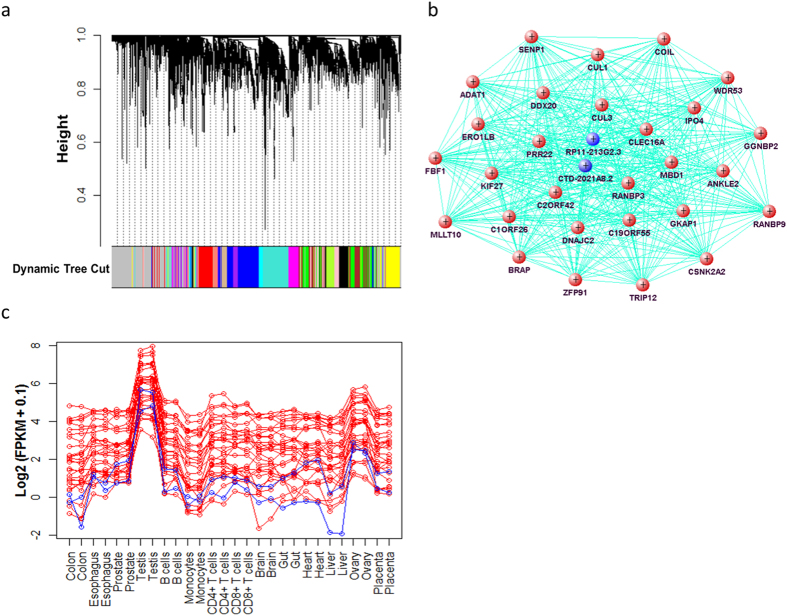
Figure 6. Co-expression network based on the TSNTs and TSCTs.
(a) Clustering dendrogram based on the dissimilarity of expression profiles of all 4,471 TSNTs and TSCTs. Each colored bar (below) of the dynamic tree cut represents each module. (b) Network of the 30 most highly connected transcripts in the brown module. Each node is one transcript, represented by the gene name corresponding to the transcript. The 2 blue nodes correspond to 2 TSNTs, and the other 28 nodes are 28 TSCTs. Each edge represents the topological overlap or interconnectedness between two nodes. (c) Expression patterns of the 30 hub transcripts. Red lines are the expression levels of the 28 TSCTs and blue lines are the expression levels of the 2 TSNTs. X-axis is the sample names, and Y-axis is log2 (FPKM + 0.1) values.

