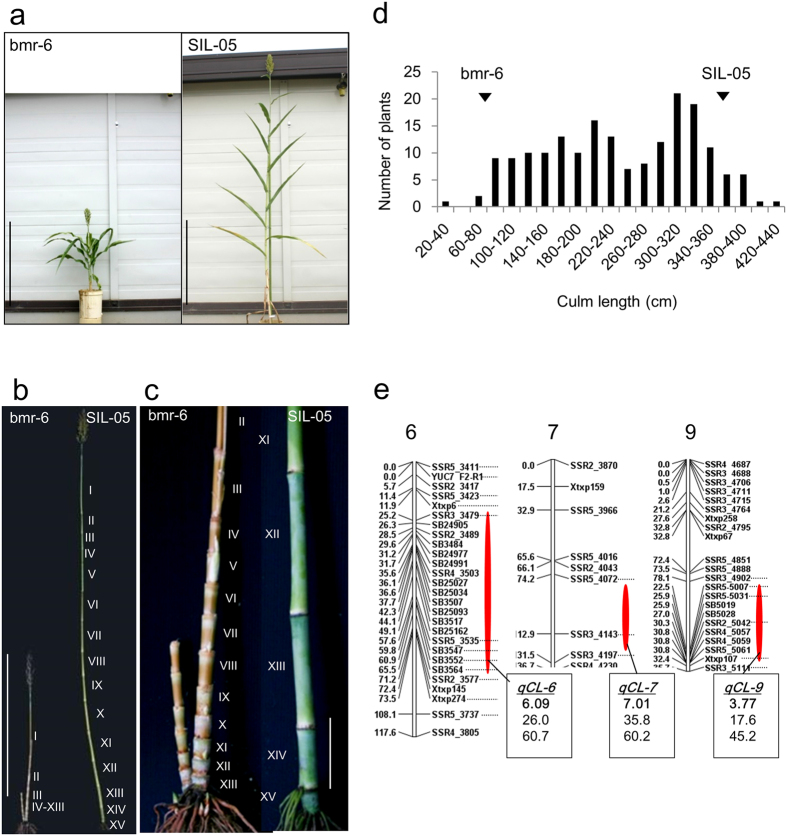
Figure 1. QTL analysis of CL.
(a) Plant stature of two cultivars used in this study; (Left) Three-dwarf cultivar carrying three dwarfing genes, bmr-6, and (Right) zero-dwarf cultivar carrying no dwarfing genes, SIL-05. Bar = 1 m. (b) An elongation pattern of internodes. Bar = 1 m. (c) The enlarged views of the basal regions of (b). Bar = 10 cm. (d) Distribution frequency of CL among 185 F2 plants from a cross between bmr-6 and SIL-05. Phenotypic values for bmr-6 and SIL-05 are indicated by arrowheads. (e) QTL analysis of CL using 96 F2 plants. Only chromosomes 6, 7, and 9, which had log-likelihood value (LOD) score > 3, were presented. The positions and names of the DNA markers used for the analysis are indicated at the left and right sides, respectively. Red ellipses indicate the positions of the QTLs for CL. Boxes contain, in order, the QTL name (bold and underlined), LOD score (bold), percentage of variance-explained, and additive effect, a positive value indicates that the allele from SIL-05 increases CL.

