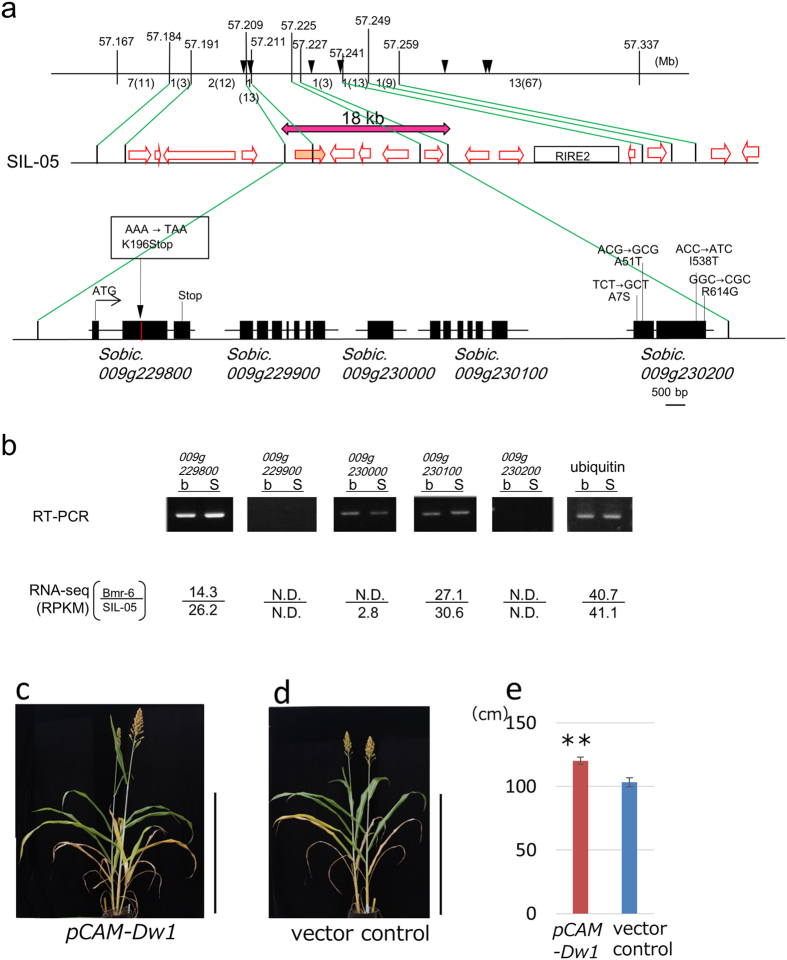
Figure 2. Positional cloning and Phenotypic complementation of the corresponding gene of qCL-9.
(a) High-resolution physical map of qCL-9. On the upper horizontal line, vertical lines indicate the positions of DNA markers with their physical positions (Mb) in Phytozome ver.9.1 (Sorghum bicolor ver.1.4). Numbers of recombinants are shown between markers. The number of progeny examined in the next generation is presented in parentheses. Arrowheads indicate the physical positions of the DNA markers used in Table 2. The middle horizontal line is a schematic representation of the gene arrangement near the candidate region, which was predicted by the BAC sequence of SIL-05. Open arrows indicate the positions of predicted genes. The mapping analysis narrowed the candidate region to the 18 kb shown by a red double-headed arrow. RIRE2 indicates a gypsy-type retrotransposon. The bottom horizontal line represents an enlarged map of the 18 kb region. There are five predicted genes, whose exons are represented as black boxes. A premature stop codon detected in the bmr-6 genome is indicated in the box. (b) The expression level of each gene determined by semi-quantitative RT-PCR. The reads per kilo-base per million reads (RPKM) scores are also shown. N.D. means the sequence was not detected. (c) Introduction of DNA fragment encompassing the Dw1 gene (SIL-05 allele) (pCAM-Dw1) into NIL-dw1 plant Bar = 1 m. (d) Empty vector introduced NIL-dw1 plant was used as a control (vector control). Bar = 1 m. (e) The culm lengths of the transgenic plants with Dw1 gene (left) and empty vector (right). Error bars represent the standard deviation. Double asterisk indicates a significant difference at 1% (P <0.01) as determined by t-test.

