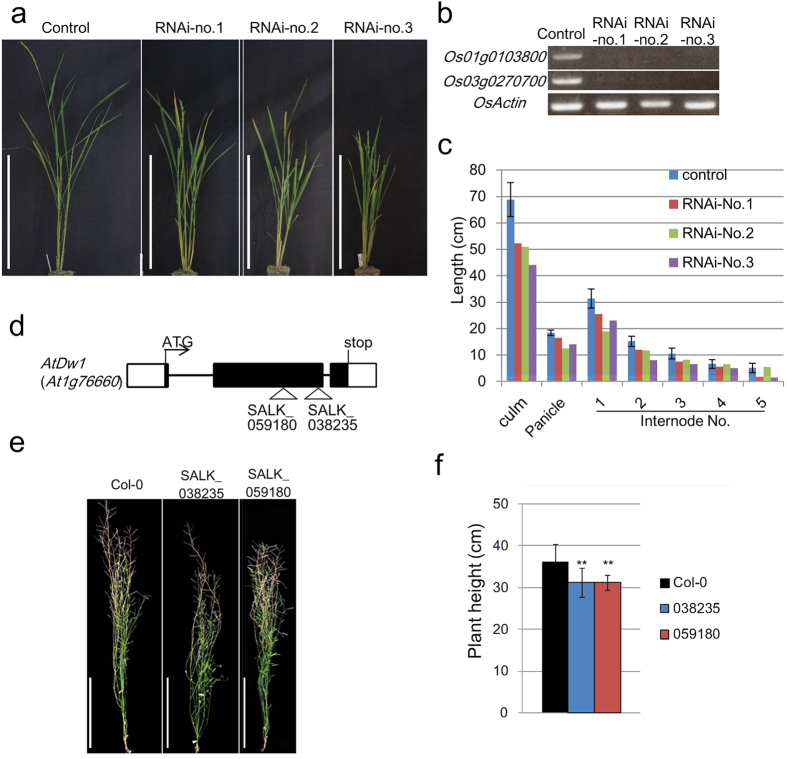
Figure 3. Semi-dwarf phenotypes of Os01g0103800 and Os03g0270700 rice RNAi lines, and of At1g76660 Arabidopsis T-DNA insertion lines.
(a) Plant stature of Os01g0103800 and Os03g0270700 RNAi lines. From left: vector control, RNAi-no.1, RNAi-no.2, and RNAi-no.3. Bar = 50 cm. (b) Expression levels of Os01g0103800, Os03g0270700, and actin (control) in the RNAi and vector control plants. (c) Length of culm, panicle, and each internode of the RNAi and vector control plants. (d) Positions of T-DNA insertions in At1g76660 (AtDw1), forming two lines (038235 and 059180). Protein coding regions and UTRs are represented by black and white boxes, respectively. Introns are indicated by black bars. ‘ATG’ and ‘Stop’ indicate the initiation and stop codon sites. (e) Phenotypes of the T-DNA insertion lines: left, 038235 and right, 059180. Scale bar = 10 cm. (f) Plant heights of the T-DNA insertion lines. Error bars represent the standard deviation. Double asterisks indicate significant differences at 1% (P < 0.01) as determined by t-test.

