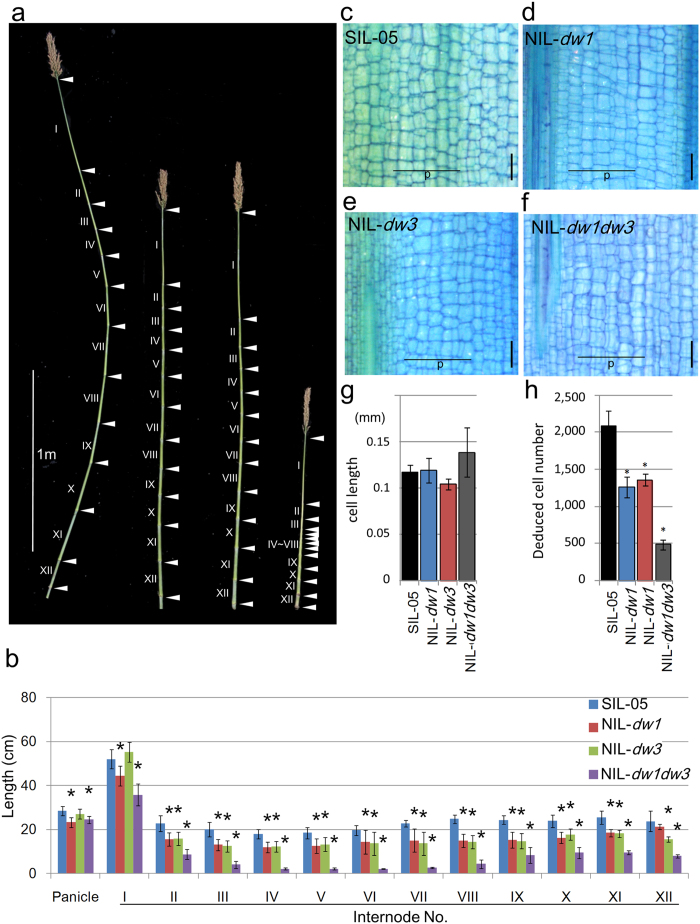
Figure 4. Genetic interactions between Dw1 and Dw3.
(a) The internode elongation patterns of the NILs and their background lines. From left to right: SIL-05, NIL-dw1, NIL-dw3, and NIL-dw1dw3. Leaves were removed to observe nodes and internodes. Roman numbers indicate the position of the internode (counted from the top). Arrowheads indicate nodes. (b) The average lengths of each internode calculated using seven plants. From left to right: SIL-05, NIL-dw1, NIL-dw3, and NIL-dw1dw3. (c–f) Longitudinal sections of the middle of internode IX from NILs and SIL-05. The parenchyma cells were examined. Vertical bars = 200 μm. (g,h) Length and deduced number of parenchyma cells of internode IX calculated from five cell files of parenchyma cells (shown as “p” in panels c–f). Error bars represent the standard deviation. Single and double asterisks indicate significant differences at 5% (P < 0.05) and 1% (P < 0.01) levels of significance, respectively, as determined by t-test.

