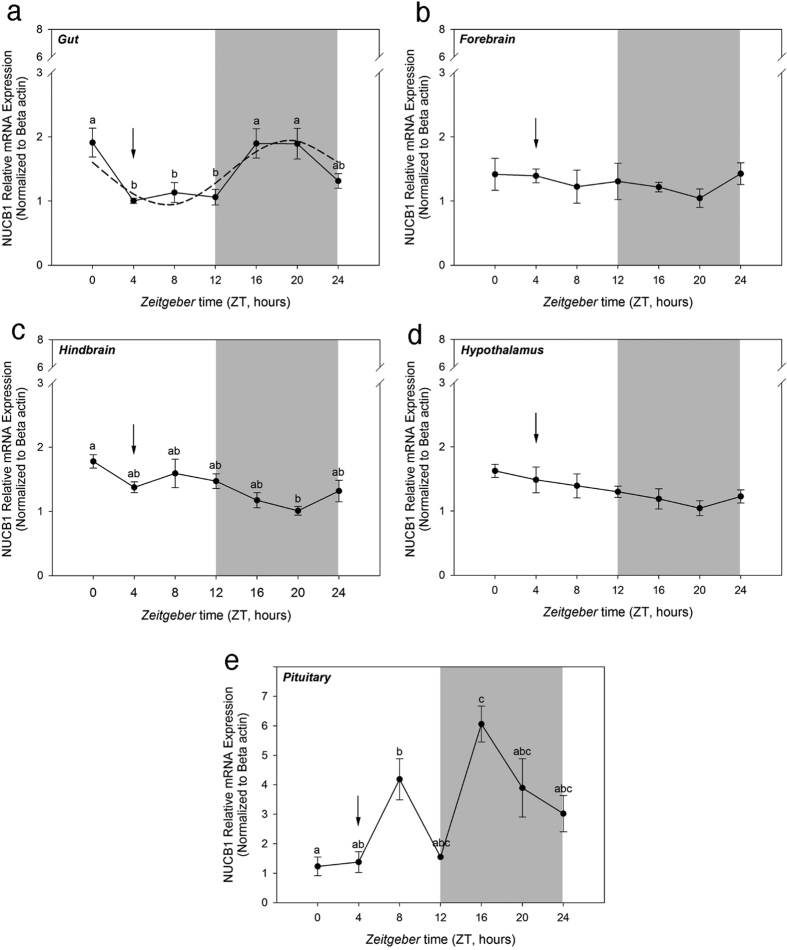
Figure 4. NUCB1 mRNA expression displayed a rhythmic pattern in the gut and pituitary of goldfish.
Expression of NUCB1 mRNA expression in the gut (a), forebrain (b), hindbrain (c), hypothalamus (d) and pituitary (e) of goldfish maintained under 12L: 12D photoperiod and scheduled feeding. The mRNA expression data was normalized to beta-actin. Data are presented as mean + SEM. The grey areas represent the night time and arrows indicate feeding time. Different alphabets denote significant differences between the time points (P < 0.05, n = 6 fish/group). One-way ANOVA (non-parametric) followed by Tukey’s multiple comparison test was used for statistical analysis. The dashed line in figure b indicates a significant rhythm determined by cosinor analysis.

