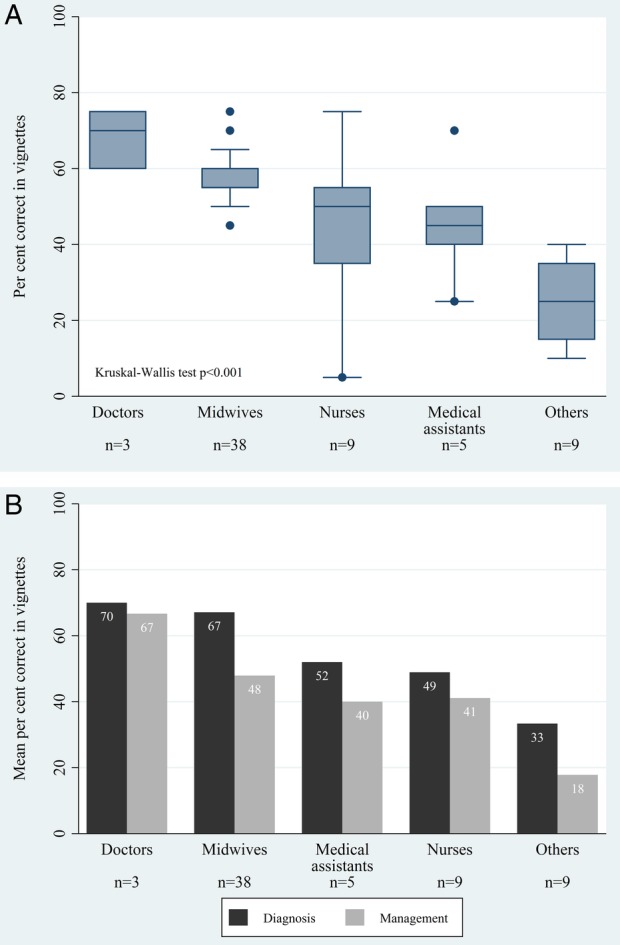
Figure 1.

(A) Per cent correct in vignettes by respondent cadre in delivery facilities (n=64). The boxes show the middle 50% of the scores, the vertical lines show the range of scores, the central horizontal line represents the median score, and outliers are represented by the dots. Group ‘others’ includes health assistants, health extension workers, traditional birth attendants and ward assistants. (B) Mean per cent correct in vignettes by respondent cadre (n=64) and by vignette section. Group ‘others’ includes health assistants, health extension workers, trained traditional birth attendants and ward assistants.
