Fig. 3.
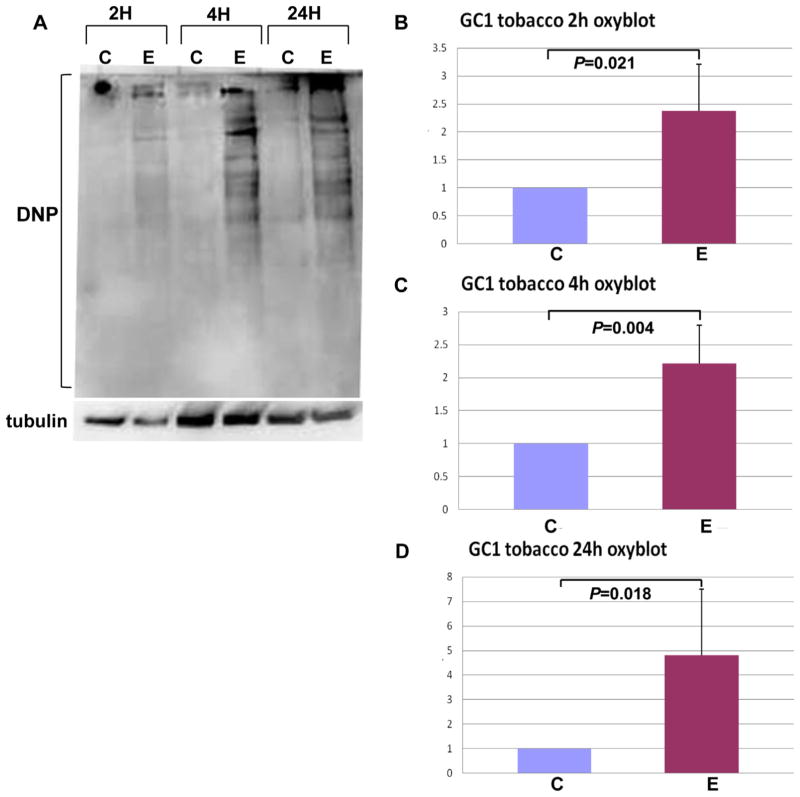
GC-1 spermatogonia cell line was treated with 5% CSE for 2, 4 and 24 h. Exposed cells (E) were compared to non-treated control (C) for each time point. (A) Protein samples were used for the Oxyblot analysis to detect the amount of carbonyl groups on cellular proteins which are introduced into protein side chains as a result of protein oxidation. Western blotting was performed using an antibody specific to the DNP moiety of the proteins. Equal loading was determined using anti-β-tubulin antibody. In each experiment, controls were considered as 1 and other samples – 2 (B), 4 (C) and 24 (D) h were normalized to the controls. To calculate the difference between samples, Student’s paired t-test was used.

