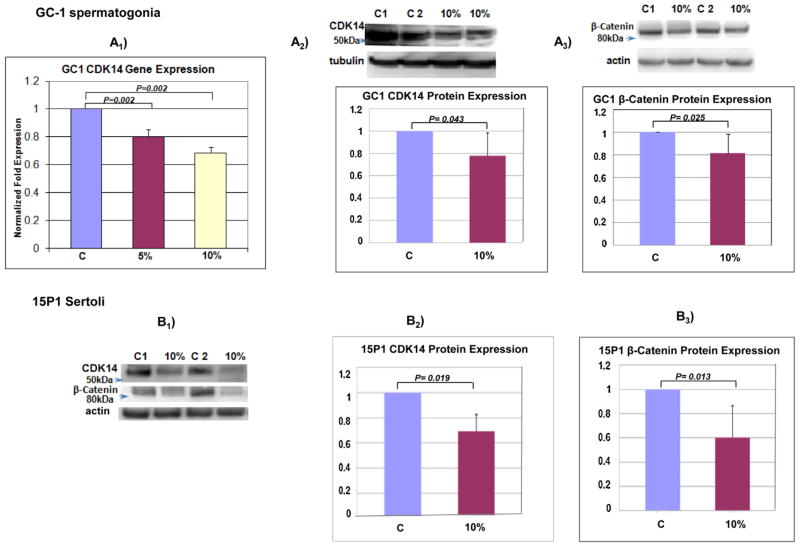
Fig. 4.
(A1) Real time RT-PCR analysis of Cdk14 expression in GC1 spermatogonia cells treated with 5 and 10% CSE for 5 h. qPCRwas performed in triplicate and the results were normalized to Gapdh content of each sample. In each experiment, the results were normalized to control which was considered as 1. To calculate the difference between samples, Student’s paired t-test was used. (A2) A western blot analysis of CDK14 expression in GC1 cells treated with 10% CSE for 24 h. Densitometry data from six experiments are shown. Density values were normalized to tubulin. In each experiment, controls (untreated samples) were considered as 1 and other samples were normalized to the controls. (A3) A western blot analysis of β-catenin expression in GC1 cells treated with 10% CSE for 24 h. Densitometry data from four experiments are shown. Density values were normalized to actin. (B1) A representative western blot of CDK14 and β-catenin expression in 15P1 Sertoli cells treated with 10% CSE for 24 h. (B2) A western blot analysis of CDK14 expression in 15P1 Sertoli cells treated with 10% CSE for 24 h. Densitometry data from four experiments are shown. Density values were normalized to actin. (B3) A western blot analysis of β-catenin expression in 15P1 Sertoli cells treated with 10% CSE for 24 h. Densitometry data from four experiments are shown. Density values were normalized to actin.

