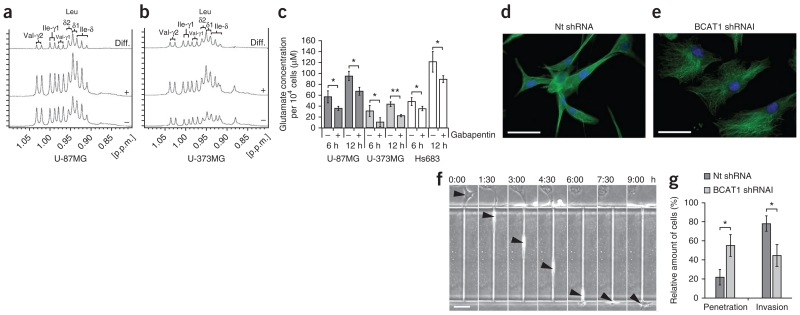
Figure 4.
BCAT1 suppression reduces glutamate release by glioma cells and limits glioblastoma cell invasion potential. (a,b) BCAA methyl group region of the 1H-NMR spectra obtained from extracts of U-87MG (a) and U-373MG (b) cells after treatment with solvent control (−) or 20 mM gabapentin (+) for 20 h. The horizontal axis represents the resonance frequency in p.p.m. relative to the trimethylsilyl propionate (TSP) reference. The vertical axis represents absolute signal intensities scaled to a constant cell count. Difference (diff.) spectra (treatment minus control) are shown at the top. After inhibitor treatment, the levels of valine (Val), leucine (Leu) and isoleucine (Ile) increased by factors of 1.09, 1.38, 1.19, respectively, in U-87MG cells and by factors of 1.83, 2.18 and 2.32, respectively, in U-373MG cells. δ values indicate chemical shifts, and γ values indicate gyromagnetic ratios. (c) Glutamate release by glioma cells at 6 and 12 h after the start of treatment with 20 mM gabapentin for BCAT1 inhibition (+) or solvent control (20 mM HEPES; −). Values represent the mean ± s.d. for n = 3 replicates. *P < 0.05, **P < 0.01 compared to the respective controls (Student’s t test). (d,e) Immunofluorescence labeling of tubulin (green) in control (d) and BCAT1 knockdown (e) U-87MG cells. Blue, DAPI. Scale bars, 50 μm. (f) Sequential images showing the permeation of a U-87MG cell (arrowheads) through a 5 μm × 11 μm × 300 μm microchannel over a period of 9 h. Scale bar, 100 μm. The labels above the images show the time elapsed as hours:minutes. (g) Effect of BCAT1 knockdown on the invasion potential of U-87MG cells compared to cells transduced with nontargeting shRNA. Results indicate the mean ± s.d. of three independent replicates (*P = 0.0146, Student’s t test).

