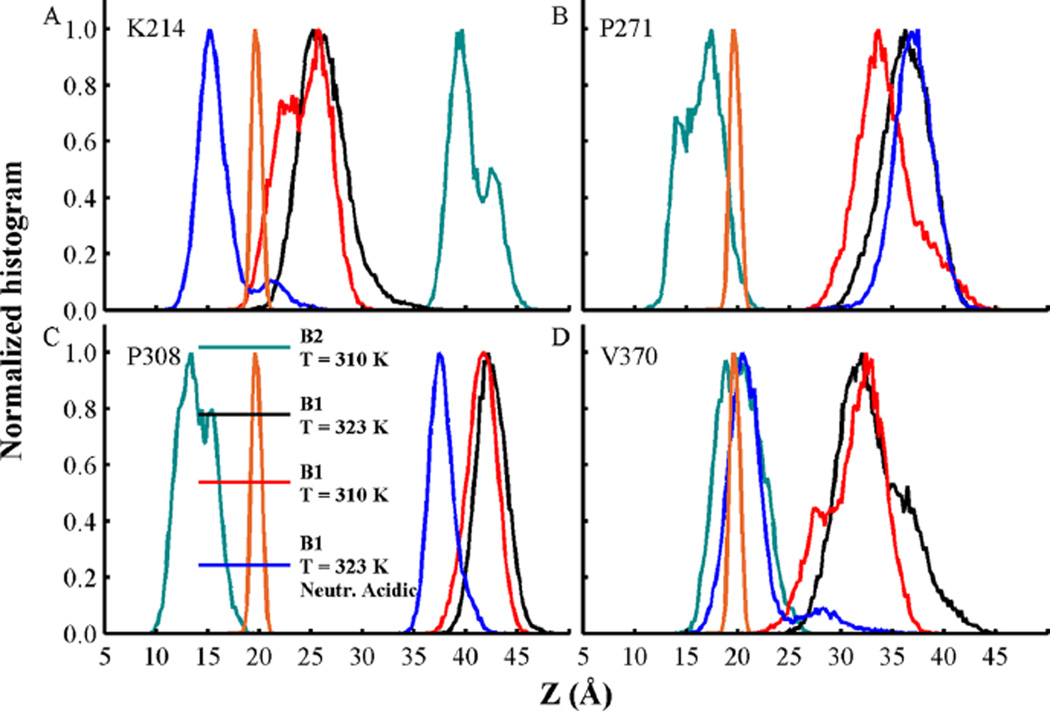
Figure 10.
Normalized density of insertion depth of Cα atoms from residues (A) K214, (B) P271, (C) P308, and (D) V370. The distance Z is measured from the center of the bilayer at Z = 0 along the bilayer normal axis. Histograms from membrane-bound conformations B1 and B2 at T = 310 K are shown in black and cyan, respectively. Simulations at T = 323 K of membrane-bound conformation B1 with acidic side-chains in their standard and neutralized state are shown in red and blue, respectively. Data was obtained from the last 500 ns of each simulation. Phosphate group density computed over all MD simulations is shown as a reference in orange lines.

