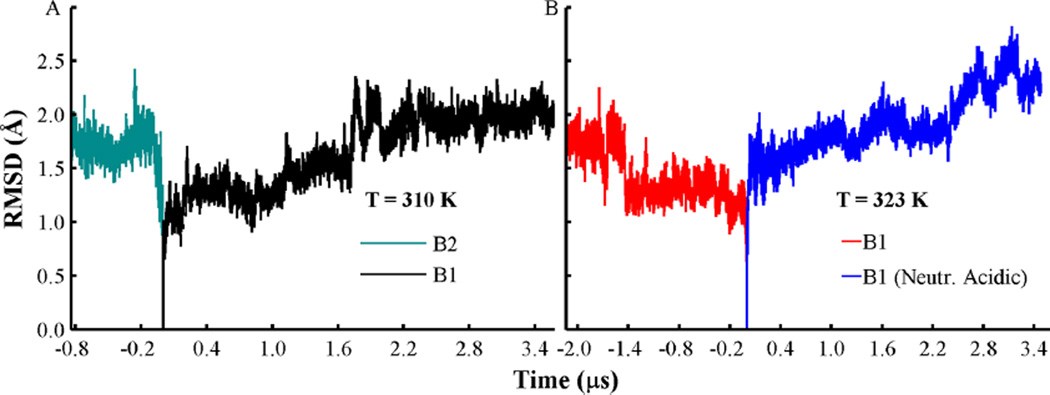
Figure 2.
Changes of the Cα root mean squared deviation (RMSD) from helices TH1–9, with TH5′ relative to the initial protein coordinates. (A) RMSD traces obtained from orientation B1 (black line) and orientation B2 (cyan). Simulations were performed at T = 310 K. (B) RMSD curves obtained from orientation B1 (red) and with acidic side-chains neutralized (blue lines). Simulations were performed at T = 323 K. All histidines are set in their protonated state in all simulations, and other acidic residues are set in their standard state, unless indicated.

