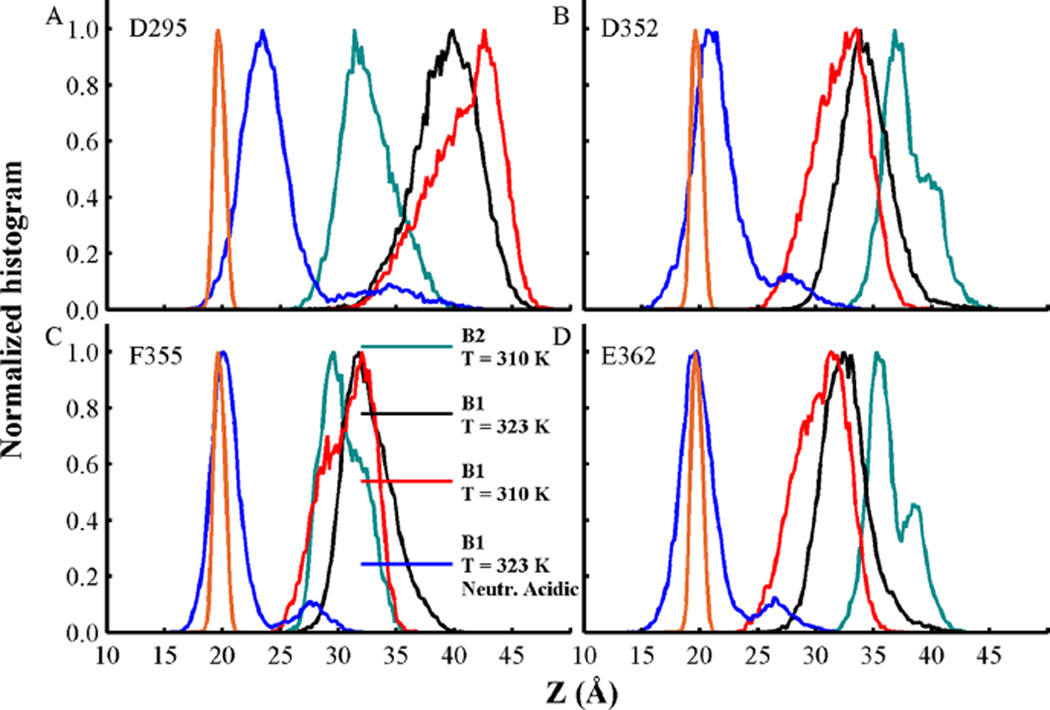
Figure 8.
Normalized density of insertion depth of Cα atoms from residues (A) D295, (B) D352, (C) F355, and (D) E362. The distance Z is measured from the bilayer center located at Z = 0 along the bilayer normal axis. Histograms from membrane-bound conformations B1 and B2 at T = 310 K are shown in black and cyan, respectively. Simulations at T = 323 K of membrane-bound conformation B1 with acidic side-chains in their standard and neutralized state are shown in red and blue, respectively. Phosphate group density computed over all MD simulations is shown as a reference in orange lines. Data was obtained from the last 500 ns of each simulation.

