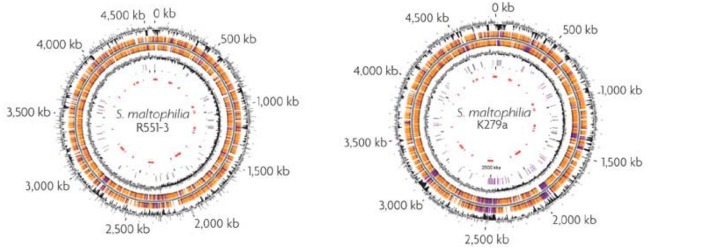
FIGURE 4.
Genome maps of the poplar endophyte S. maltophilia R551-3 and of the opportunistic pathogen S. maltophilia k279a. From the outside-in, the circles represent coordinates in kilobase pairs (kbp), % GC content, predicted open reading frames (ORFs) in the clockwise and anticlockwise orientations, GC skew [(G-C and G+C) in a 1000-bp window], transposable elements (pink) and pseudogenes (gray) and the putative S. maltophilia k279a genomic islands (red; Ryan et al., 2009). Reproduced with permission.

