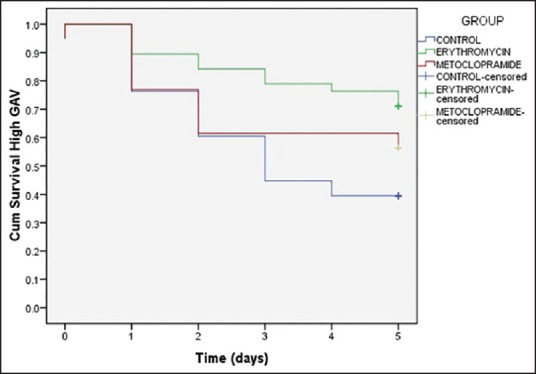
Figure 3.

Kaplan-Meier analysis curve showing proportion of patients having high gastric aspirate volume. A significant difference in proportion of patients not having high gastric aspirate volume at different days was found with group erythromycin (P= 0.027, log-rank test)
