Figure 4.

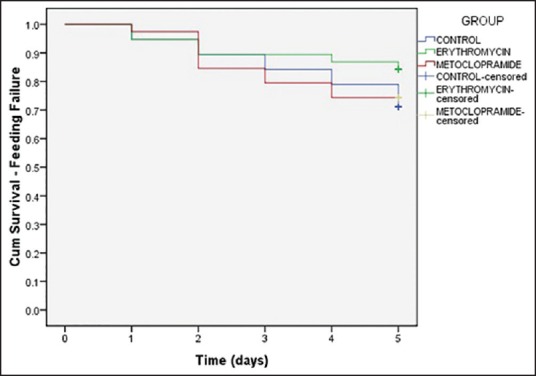
Kaplan-Meier analysis curve showing proportion of patients having feeding failure. No significant difference was found in proportion of patients not having feeding failure between the three group with increasing number of days

Kaplan-Meier analysis curve showing proportion of patients having feeding failure. No significant difference was found in proportion of patients not having feeding failure between the three group with increasing number of days