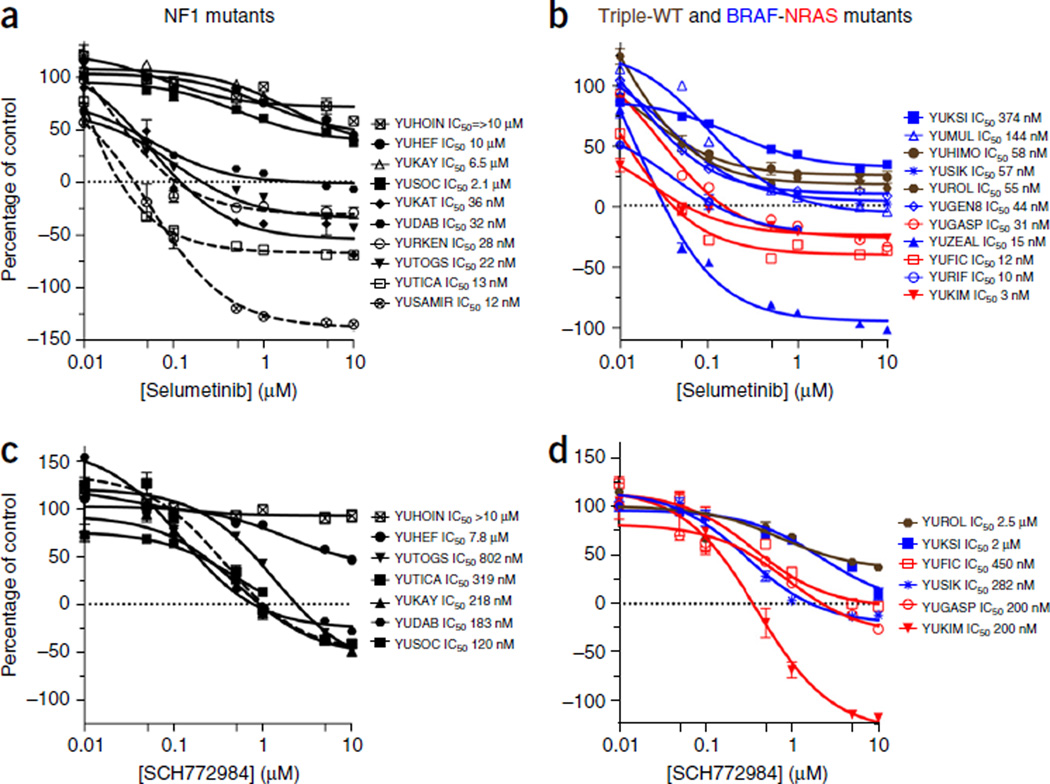
Figure 3.
Growth responses to selumetinib and SCH772984. (a–d) Growth of NF1-mutant (a,c) and of triple–wild-type (brown), BRAFV600-mutant (blue) and NRAFSQ61-mutant (red) melanoma cell lines (b,d). In a, the NF1 mutants YURKEN, YUTICA and YUSAMIR (dashed lines) are double-mutant cell lines (BRAFV600E, NRASQ61R and BRAFV600E, respectively) that express normal levels of NF1. The rest of the lines are null for NF1 (Fig. 2a). The selumetinib experiments were repeated at least twice. The data represent cell viability (CellTiter-Glo luminescent assay) as a percentage of the control at the end of 72 h of treatment. Each measurement is the average of triplicate or quadruplet wells. Error bars denote s.e.m.

