
Figure 2.
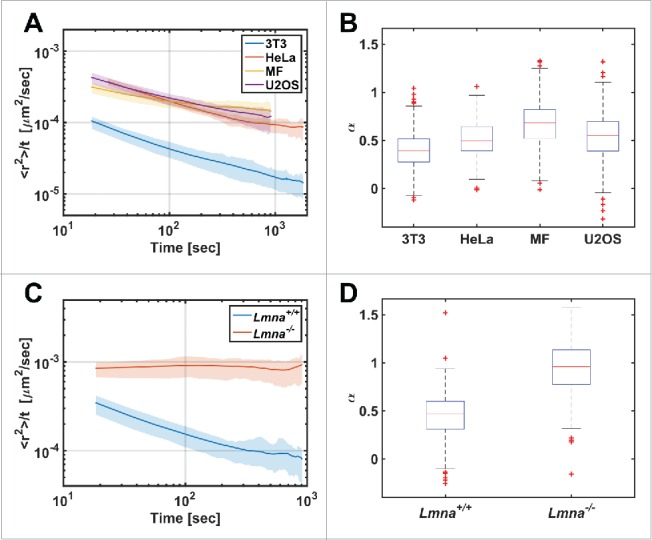
Diffusion patterns of telomeres in different cell types. (A) MSD/Δt vs Δt plot in log-log scale for different cell lines. (B) The distribution of α coefficient obtained from single telomeres trajectories (n=325, 166, 551, 958 for the 3T3, HeLa, MF, U2OS cell-lines respectively). (C) MSD/Δt vs Δt plot for Lmna+/+and Lmna−/− cells. (D) Box plot for the α coefficients distribution (n=223, 525 for the Lmna+/+ and Lmna−/− cells respectively). Note the significant difference showing anomalous diffusion in Lmna+/+ and normal diffusion in Lmna−/− cells.