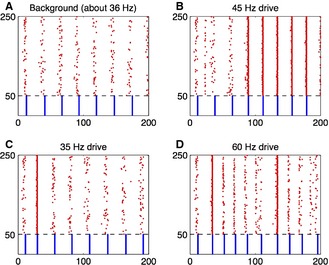
Figure 4.

Frequency selectivity occurs in large, heterogeneous E–I networks. Spike rastergram for weak PING. Red dots indicate spike times of E‐cells, and blue dots spike times of I‐cells. The horizontal axis is time in milliseconds. All parameters are as in fig. 1b of Kopell et al. (2010b), with two exceptions: (i) the network is larger here – 200 E‐cells and 50 I‐cells; (ii) synaptic inputs per cell are somewhat stronger – here, using the notation of Kopell et al. (2010b), ĝIE = ĝEI = ĝII = 1.5 (the values used by Kopell et al. were ĝIE = 1.5, ĝEI = ĝII = 0.5.) (A) PING rhythm without forcing. (B–D) Same as (A), but with additional oscillatory input of different frequencies to both E‐cells and I‐cells. The form of the additional input is I(t) = 1 + tanh(10[cos(2πt/T) − 1]), where T is the period, and with a constant of proportionality chosen so that the temporal average of I(t) equals 1 (for E‐cells) and 0.5 (for I‐cells).
