
Figure 1. Effect of Ivacaftor on CFTR function and Symptoms of Chronic Bronchitis.
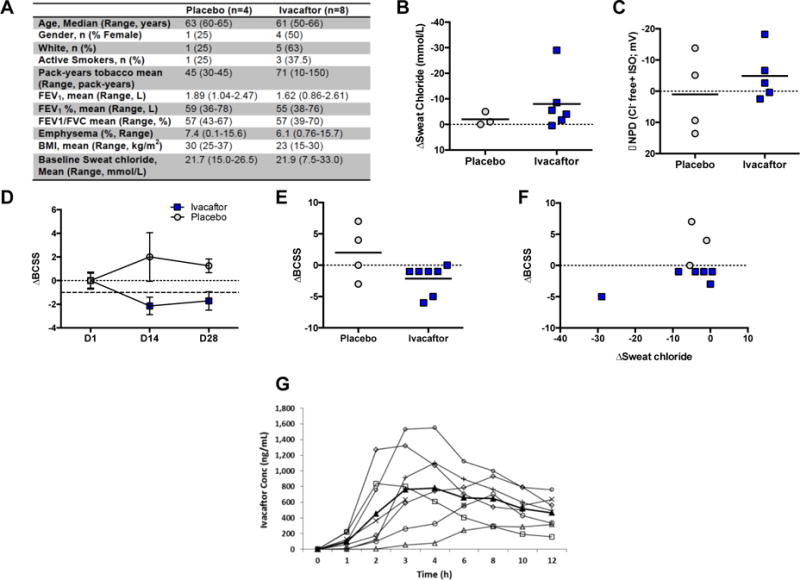
A. Baseline Characteristics of subjects enrolled in each treatment arm. BMI=body mass index. FEV1%= percent predicted forced expiratory volume in 1 second. B. Change in sweat chloride after 14 days of treatment compared to baseline. C. Change in CFTR-dependent chloride conductance (Δchloride-free plus isoproterenol) after 14 days of treatment compared to baseline. D. Change in Breathlessness, Cough, and Sputum Scale (BCSS) scores after 14 days of treatment (D14) and after 14-day washout period (D28, ±SEM). The range of BCSS is 1–12, and the MCID is 1 unit. E. Individual change in BCSS scores after 14 days of treatment compared to baseline. F. Correlation of BCSS to change in sweat chloride after 14 days of treatment. G. Pharmacokinetic profile of subjects taking ivacaftor after first dose (n=8). Each line represents an individual subject; heavy black line designates mean value. All P values are paired t-tests, within subject, per study protocol. Between subject testing was limited by small sample sizes.