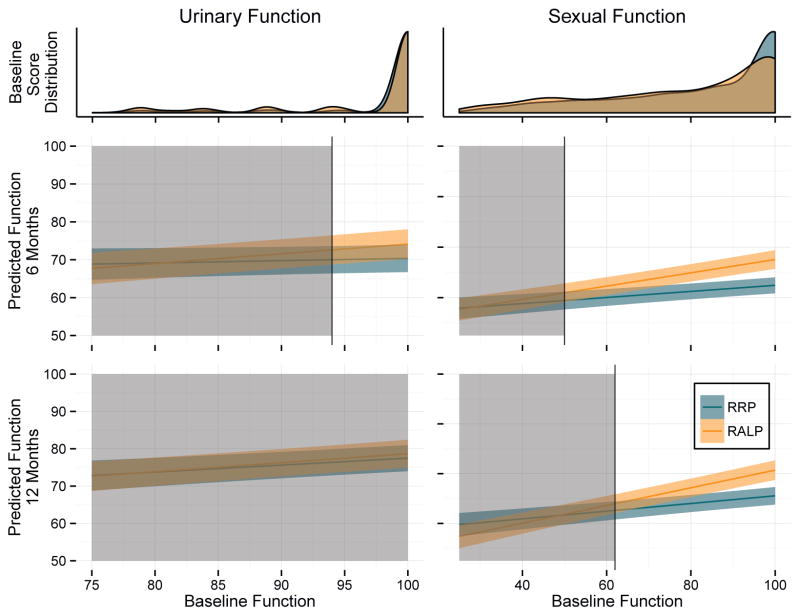
Figure 1.
Model based predicted postoperative function by baseline function and distribution of baseline function scores. Shaded areas indicate that between-group differences in predicted function are not statistically different at significance level of 0.05. Unshaded areas represent statistically significant differences at p <0.05. Colored bands represent 95% CIs for predicted scores. Overlap of intervals does not indicate that differences are nonsignificant.

