
Figure 3.
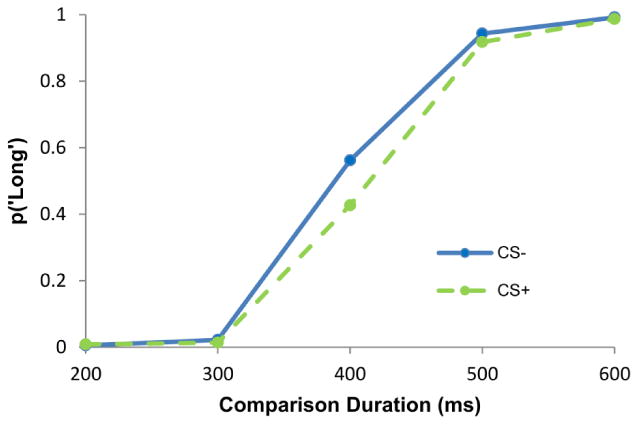
Average proportions of long responses made for each comparison duration on CS+ and CS- trials demonstrates the underestimation bias on CS+ trials.
Official websites use .gov
A
.gov website belongs to an official
government organization in the United States.
Secure .gov websites use HTTPS
A lock (
) or https:// means you've safely
connected to the .gov website. Share sensitive
information only on official, secure websites.
Average proportions of long responses made for each comparison duration on CS+ and CS- trials demonstrates the underestimation bias on CS+ trials.