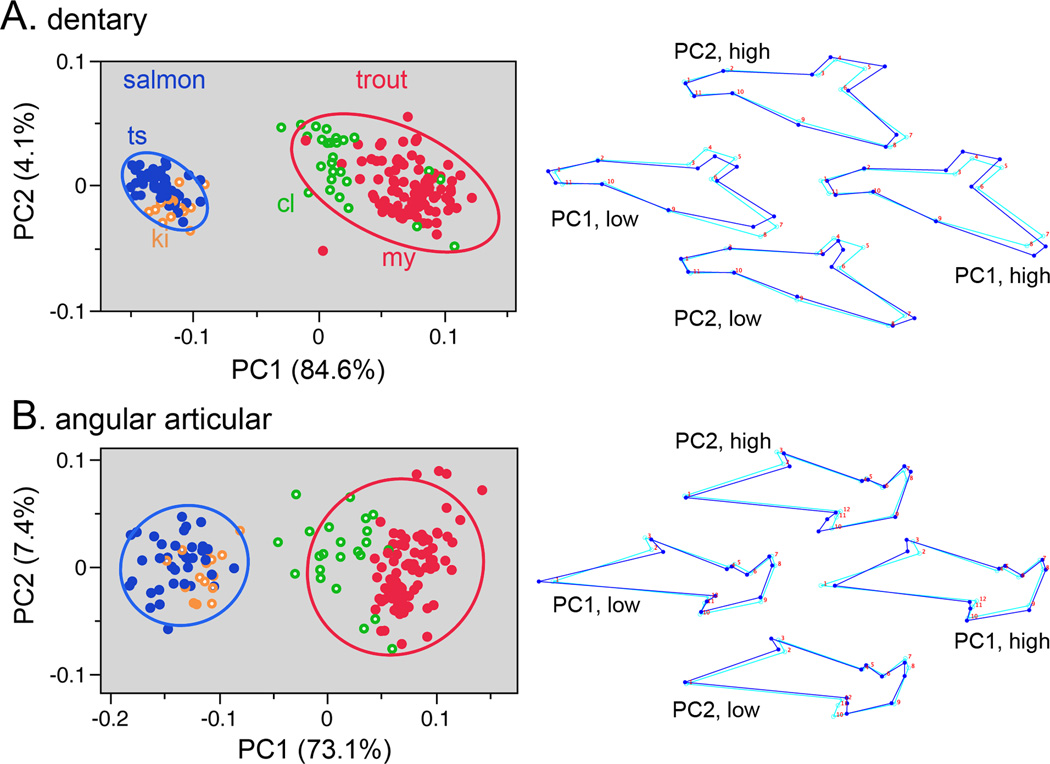
Fig. 4.
Principal component analyses (PCAs) reveals shape divergences for the dentary (A) and angular articular (B) between salmon (2 species) and trout (2 species), and including 95% density ellipses. The data include all of the populations listed in Table 1. Species abbreviations as in Fig. 1. Wireframe diagrams to the right show landmark configurations representing the loadings on the PCs. For each, the light blue wireframes show the consensus configuration, identical for each diagram (at PC1=0, PC2=0), and the dark blue wireframes show the deformations at high and low scores for both PCs.

