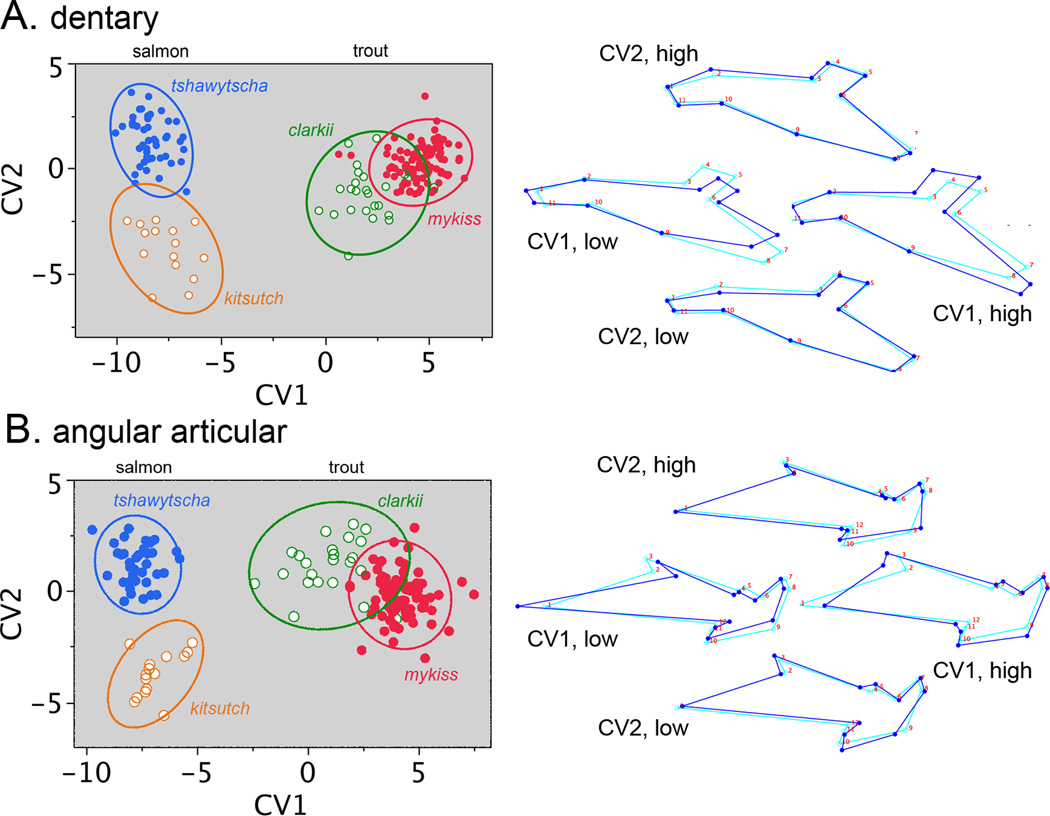
Fig. 5.
Canonical variate analyses (CVAs) reveal among-species differences in bone shapes. Presentation as in Fig. 4. The data points show individual measurements (same Procrustes transformed data as Fig. 4) grouped according to species. The plots include 95% density ellipses. Trout and salmon separate along CV1, and the two trout species, O. mykiss and O. clarkii, are also largely separated by CV1. The two salmon species O. tshawytscha and O. kisutch completely separate along CV2. To the right, the CV1 wireframe diagrams show the changes between trout and salmon (essentially identical in detail to the PC1 wireframes in Fig. 3), and the similar changes, but to a lesser degree, between O. mykiss and O. clarkii. The CV2 wireframes show the changes between O. tshawytscha and O. kisutch.

