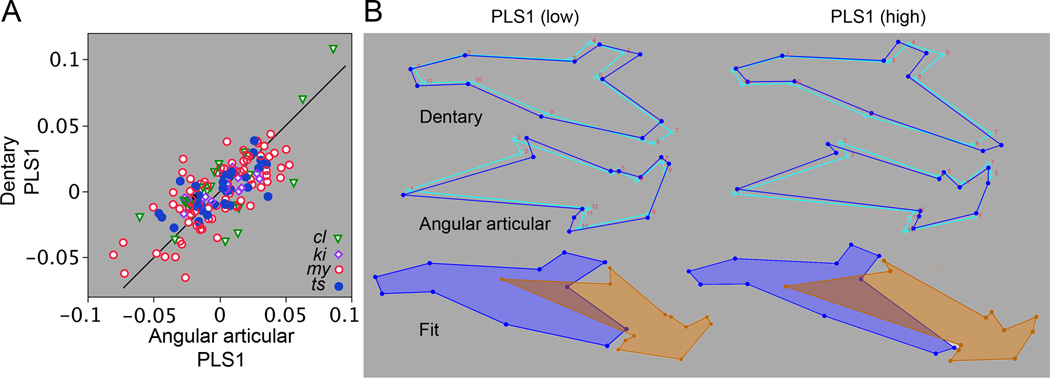
Fig. 7.
Partial least squares (PLS) pooled within group analyses reveal significant covariance between the dentary and angular articular. Our entire within-genus Oncorhynchus dataset is included, pooling is according to species. By pooling within group, each analysis examines covariance within the dataset collectively, species differences are eliminated by mean-centering. (A) RV coefficient = 0.32, p<0.0001 (permutation analysis). A. The scatter plot shows individual PLS1 scores for one bone against the other, and includes a 45° diagonal line (see text for explanation). Abbreviations are the first two letters of the species names (Fig. 1). PLS1 accounts for 71% of the total covariance, p<0.0001. B. Wireframe diagrams representing shape deformations from the mean shapes (light blue wireframes) in the positive (high) and negative (low) directions along the PLS1 axis (dark blue). The bottom diagrams illustrate the approximate fitting together of the two bones at high and low PLS1 scores.

