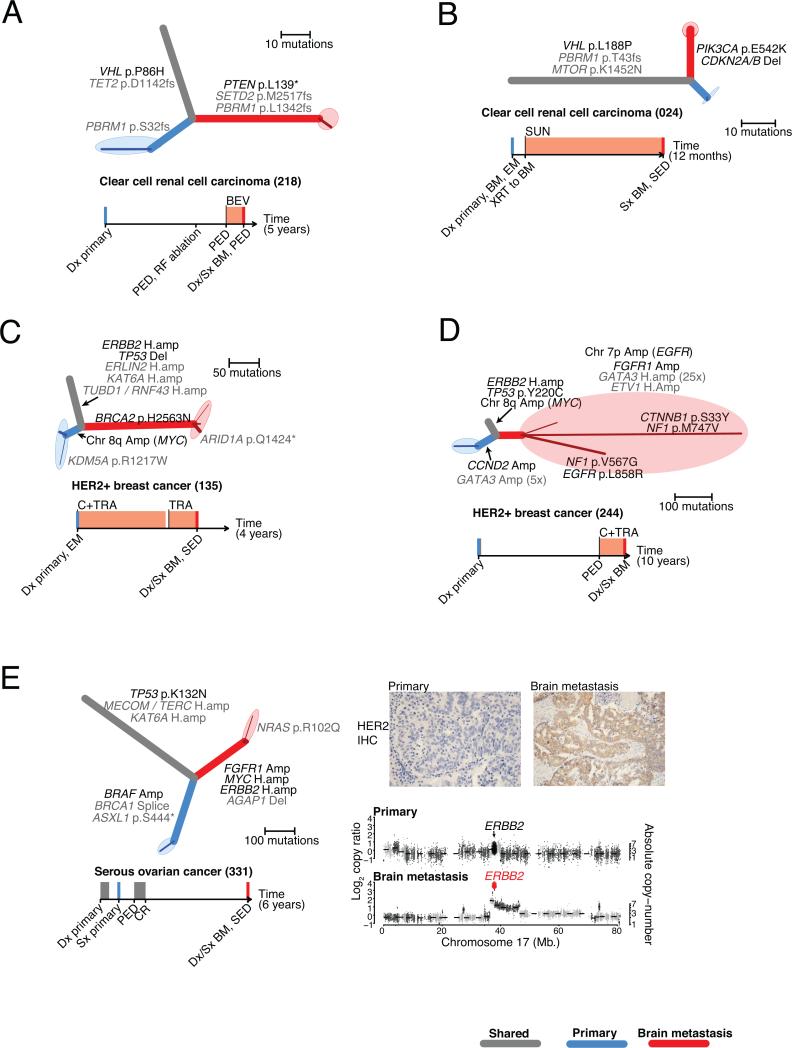
Figure 1. Brain metastases harbor clinically actionable mutations not detected in primary-tumor samples.
A-E. Phylogenetic trees inferred for five example cases. Branch colors indicate the types of tissue samples descended from each branch (grey: shared by all samples, blue: primary-tumor sample, red: brain metastasis). Darker-colored lines correspond to subpopulations of cancer cells detected with CCF < 1; the maximally branching evolutionary relationships of these clusters are drawn on the ends of each sample branch, surrounded by shaded ellipses denoting the tissue sample. The thickness of each branch is proportional to the CCF of mutations on that branch. Potentially clinically informative (TARGET) alterations (black) and additional likely oncogenic alterations (grey) are annotated onto the phylogenetic branches on which they occurred.
Timelines depict the sequence of diagnosis, treatment, and tissue sampling for each case, with chemotherapy treatment intervals denoted by grey rectangles, and treatment with specified targeted agents denoted by orange rectangles. Colored vertical lines denote collection of sequenced cancer tissues (blue: primary, red: brain metastasis).
BEV, bevacizumab; BM, brain metastasis; BM1, brain metastasis from one anatomic location; BM2, brain metastasis from second anatomic location; Bx, biopsy; C, chemotherapy; CET, cetuximab; CR, complete response; Dx, diagnosis; EM, extracranial metastasis; I-131, radioactive iodine; LAP, lapatinib; LN, lymph node; PARPi, PARP inhibitor; PBM, progressive brain metastasis; PED, progressive extracranial disease; PI3Ki, PI3K inhibitor; SED, stable extracranial disease; Sx, surgery; SUN, sunitinib; TRA, trastuzumab; WBRT, whole brain radiation therapy; XRT, radiation
E. Also shows immunohistochemical staining (IHC) for HER2 in samples of the primary tumor (left), and brain metastasis (right). In addition, genomic copy-ratios on Chromosome 17 are shown (bottom) for the primary-tumor sample (top) and brain metastasis (bottom). Large diamonds correspond to exons of ERBB2, colored according to amplification status (black: unamplified, red: amplified).

