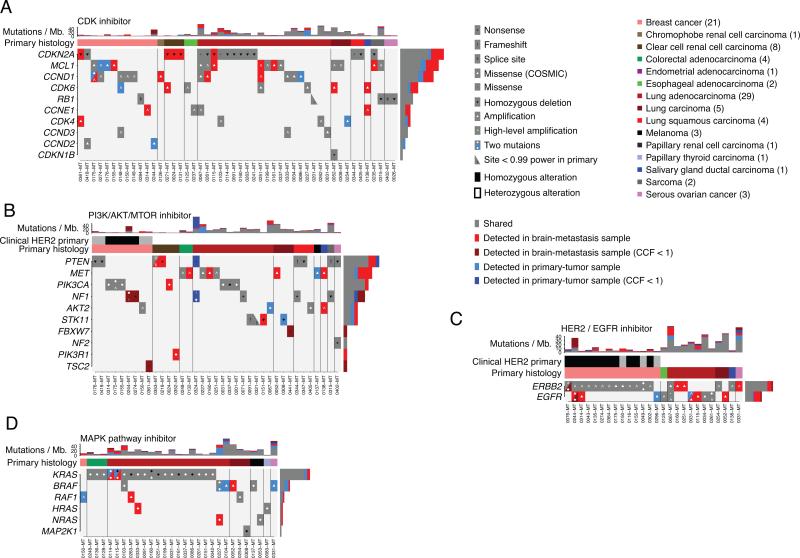
Figure 2. The landscape of potentially clinically actionable alterations in brain metastases and primary-tumor samples.
A-D. Alterations in genes (rows) that may predict sensitivity to the indicated class of targeted agent. Vertical columns correspond to cases, which are ordered by primary histology and presence/absence of alterations. Stacked bar-graphs indicating the number of somatic point-mutations detected in each phylogenetic branch of each case (columns) are shown at the top of each panel. HER2 status determined during clinical evaluation is denoted by black: positive, grey: negative, white: not measured.

