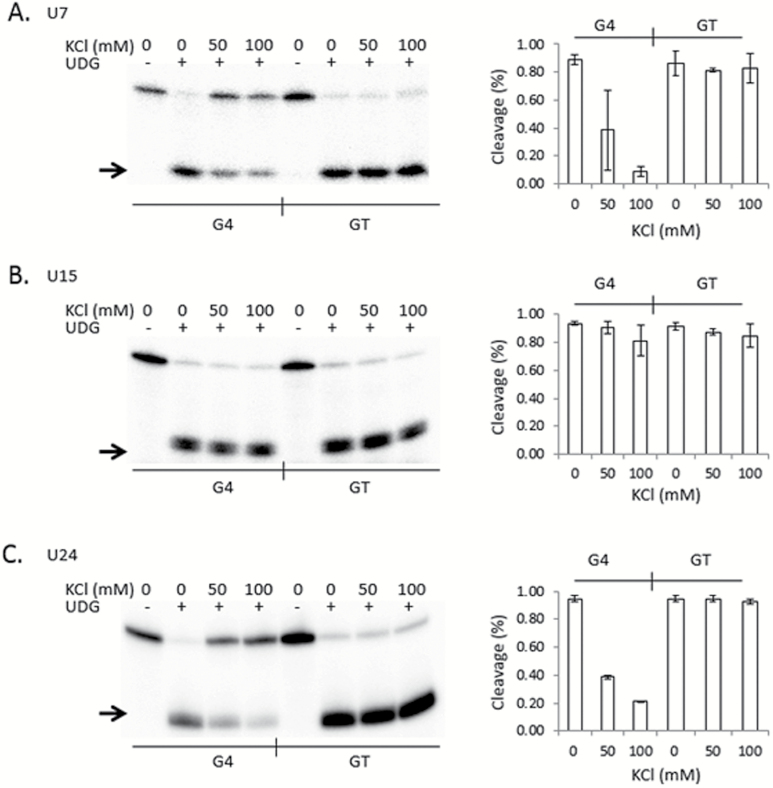
Figure 3.
G-tetrads in TCF3 G4 interfere with UDG activity. (Left) Representative phosphorimages of E. coli UDG cleavage assays for each 5′ radiolabelled oligonucleotide are shown. Reactions were performed at the indicated salt conditions (0, 50 and 100mM KCl), followed by alkaline lysis and resolution of the cleavage products by denaturing PAGE. Oligonucleotides contained a single uracil at position 7 (A), 15 (B) or 24 (C) in sequences capable of forming G4 (G4) or controls where the guanine repeats were interrupted with thymine to prohibit G4 formation (GT). The presence (+) or absence (−) of UDG is indicated at the top. An arrow shows the position of the cleavage products. (Right, A–C) Quantitation of the percentage cleaved by UDG (Y axis) for each oligonucleotide at the indicated salt concentration (X axis). Values are means from three independent experiments, with standard deviation.

