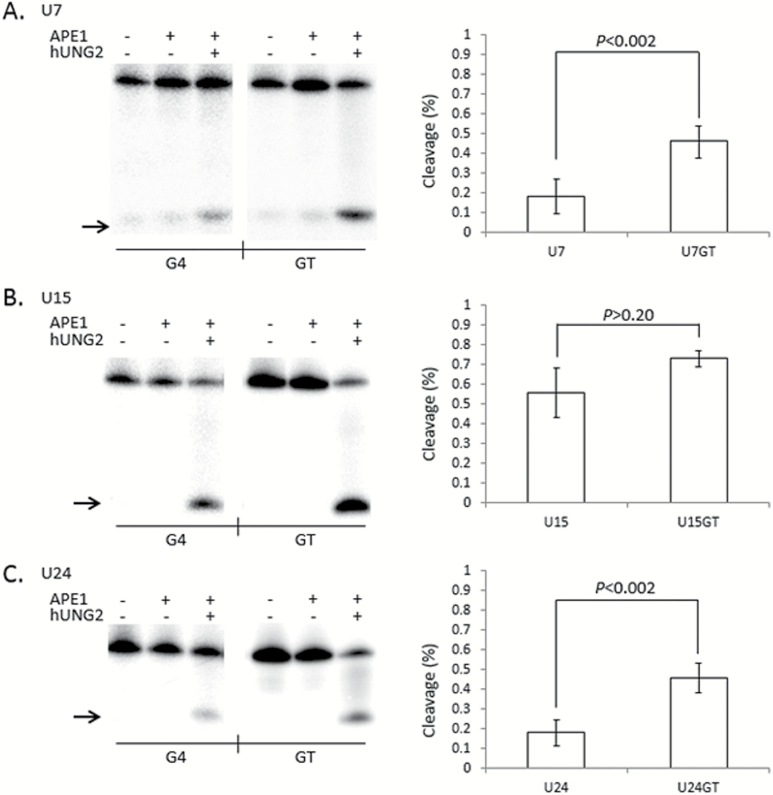
Figure 5.
G-tetrads in TCF3 G4 interfere with the cleavage step of Base Excision Repair. (Left) Representative phosphorimages showing the activity of both hUNG2 and APE1 on single uracil bases placed at positions 7 (A), 15 (B) or 24 (C) in G4 DNA folded from the TCF3 oligonucleotide (G4) or control oligonucleotides that cannot fold into G4 structures (GT). Reactions contained 100mM KCl and the presence (+) or absence (−) of hUNG2 or APE1. Cleavage products (arrow) were resolved by denaturing PAGE. (Right) Quantitation of a least three independent experiments are displayed on the right of each representative phosphorimage. The percentage cleaved by APE1 activity (Y axis) is shown for each G4 (X axis left) or GT (X axis right), with standard deviation and P values (two-tailed t-test). Both G4(U7) (P < 0.002) and G4(U24) (P < 0.002) display significant inhibition compared to GT, but G4(U15) (P > 0.20) does not.

