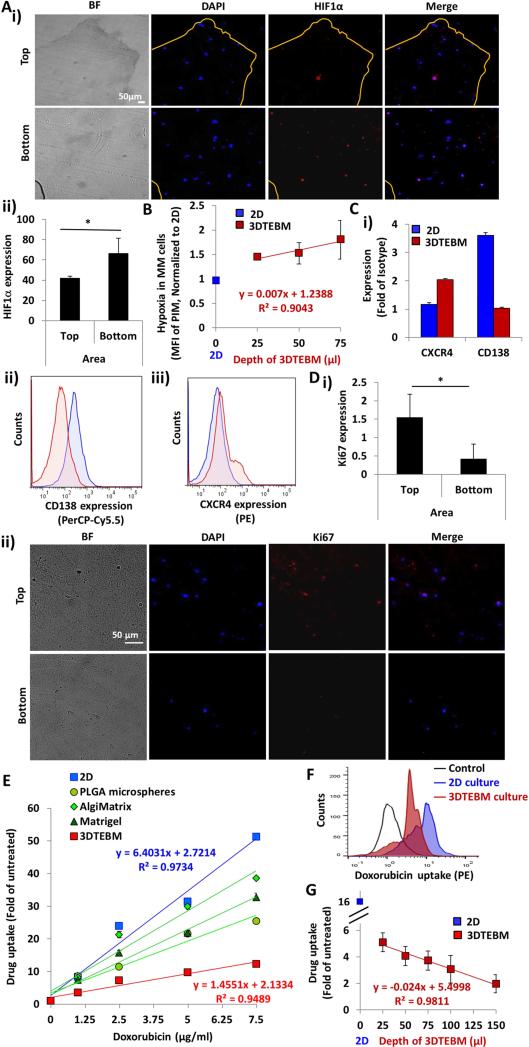
Figure 4. The 3DTEBM cultures recapitulate oxygen gradients, hypoxia and drug gradients.
A) i) Fluorescent imaging at day 5 of top and bottom sections of 3DTEBM cut longitudinally (Bright field (BF); DAPI, Blue; HIF1α, Red; Merge, Pink); Scale bar= 50 μm. ii) HIF1α expression quantified as MFI of AF488 expression in the top and bottom areas of 3DTEBM, (*) p< 0.05. B) Correlation between 3DTEBM depth and hypoxia in MM cells (MFI of PIM) compared to hypoxic state of MM cells in 2D cultures. Blue square shows drug uptake in 2D cultures, red squares show uptake in 3DTEBM. C) i) CD138 and CXCR4 expression measured as fold of MFI of PE-anti-CXCR4 and PerCPCy5.5-anti-CD138 to isotype controls in MM cells in the 3DTEBM vs 2D multi-cultures at day 3, and flow cytometry representative histogram of ii) CD138 (PerCP-Cy5.5) and iii) CXCR4 (PE). D) i) Ki67 expression measured as quantification of MFI AF488 expression in the top and bottom areas of the 3DTEBM, (*) p< 0.05. ii) Fluorescent imaging at day 5 of the top and bottom areas of 3DTEBM cut longitudinally (Bright field (BF); DAPI, Blue; Ki67, Red; Merge, Pink). Scale bar= 50 μm. E) Effect of increasing doxorubicin concentration (0 – 7.5 μg/ml) on MM cell uptake in 3DTEBM, classic 2D cultures, PLGA microspheres, AlgiMatrix, and Matrigel. F) Flow cytometry histogram representing doxorubicin uptake (PE signal) in MM cells grown in 3DTEBM and 2D cultures; Control: untreated MM cells. G) Correlation between various 3DTEBM and doxorubicin uptake of MM cells grown within. The blue square indicates doxorubicin uptake in 2D cultures (minimal depth) and red squares show uptake in various 3DTEBM scaffold depths).

