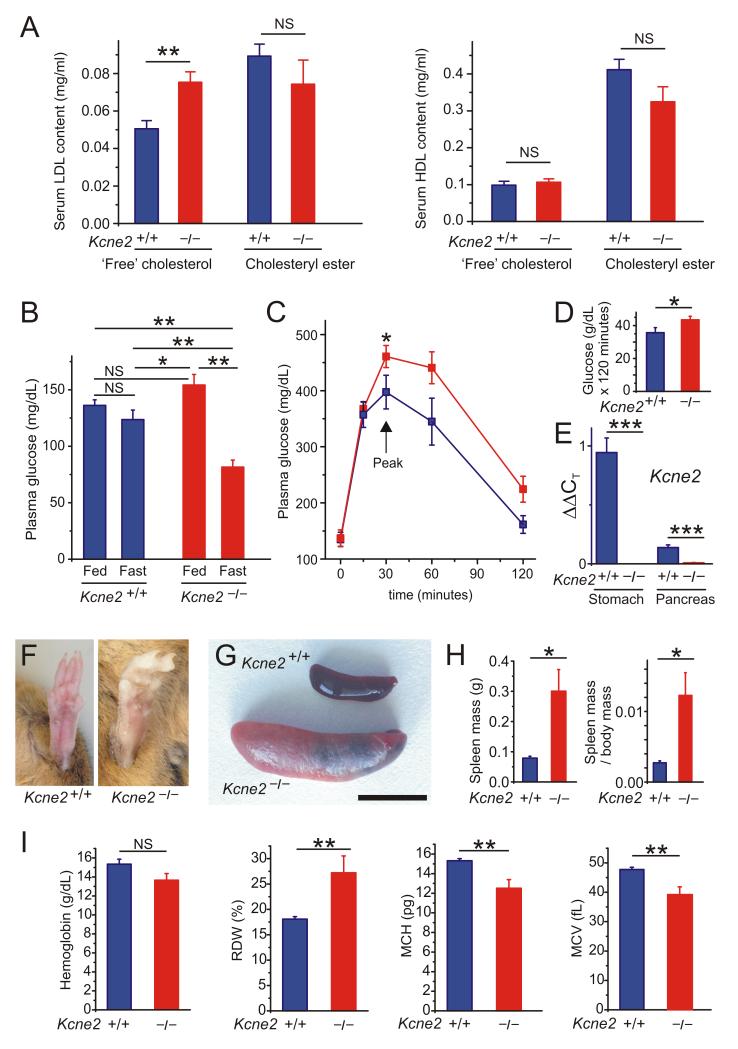
Figure 3.
Kcne2 deletion causes anemia, diabetes and dyslipidemia. A. Mean serum lipid content of 7m-old female Kcne2+/+ and Kcne2−/− mice (n = 11). **p = 0.002; NS, no significant difference between genotypes. B. Mean blood glucose content of 7m-old Kcne2+/+ and Kcne2−/− mice (n = 16-19). *p <0.05; **p < 0.01; NS, no significant difference between groups. C. Glucose tolerance test results: mean blood glucose following glucose injection in 7m-old Kcne2+/+ (n = 11) and Kcne2−/− (n = 16) mice; *p < 0 .05 between genotypes at peak glucose level. D. Integration of area under curve from data in panel C using trapezoidal rule; *p < 0.05. E. Real-time qPCR detection of Kcne2 cDNA in stomach and pancreas of Kcne2+/+ mice with Kcne2−/− mouse tissue as a negative control; ***p<0.001. F. Hind feet of adult Kcne2+/+ and Kcne2−/− mice showing example of pale extremities in the latter. G. Exemplar spleens from adult Kcne2+/+ and Kcne2−/− mice showing splenomegaly in the latter. Scale bar, 1 cm. H. Mean spleen mass and spleen mass/body mass for 7m-old Kcne2+/+ and Kcne2−/− mice (n = 7-9). *p < 0.05. I. Hemoglobin and red blood cell parameters of 4m-old Kcne2+/+ and Kcne2−/− mice (n = 5-7). **p < 0.01. NS, no significant difference between genotypes. RDW, red blood cell distribution width; MCH, mean corpuscular hemoglobin; MVC, mean corpuscular volume.

