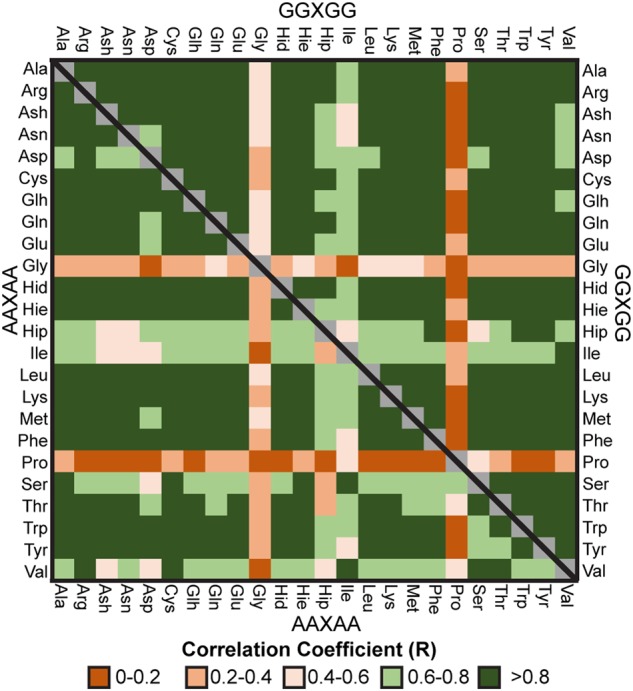
Fig. 4.

Correlation matrix for GGXGG and AAXAA simulations in native conditions (water, 298 K) using the Pearson correlation coefficients calculated between φ/ψ frequency distributions for the central guest residue. Legend for the matrix element colors is inset.
