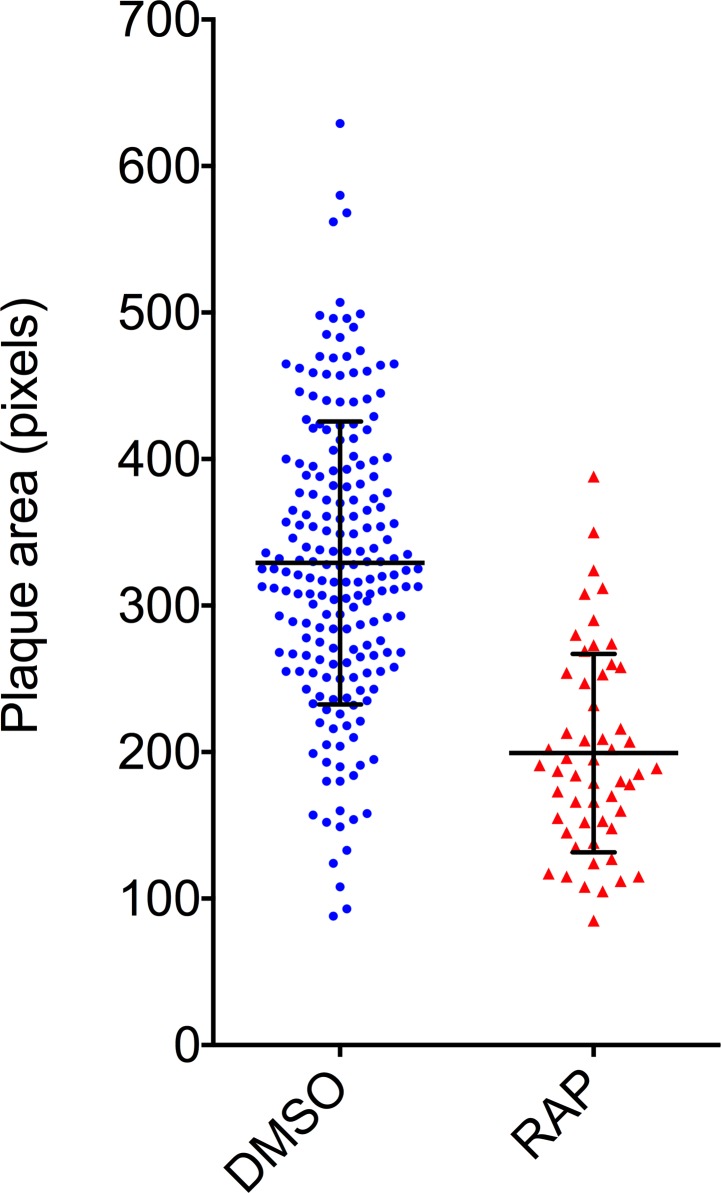
Fig 2. Phenotypic characterisation of an MSP1 mutant using the plaque assay.
Scatter plots showing the distribution of plaque sizes obtained following treatment of MSP1:loxPint parasites with DMSO (control, mock-treated) or RAP to induce DiCre-mediated truncation of MSP1. Plaque numbers (n = 205 for the DMSO-treated samples and n = 54 for the RAP-treated samples) were counted manually. Plaque dimensions were quantified using the Magic Wand tool of Photoshop CS5 (Adobe). Horizontal bars indicate mean plaque area ± 1 SD.

