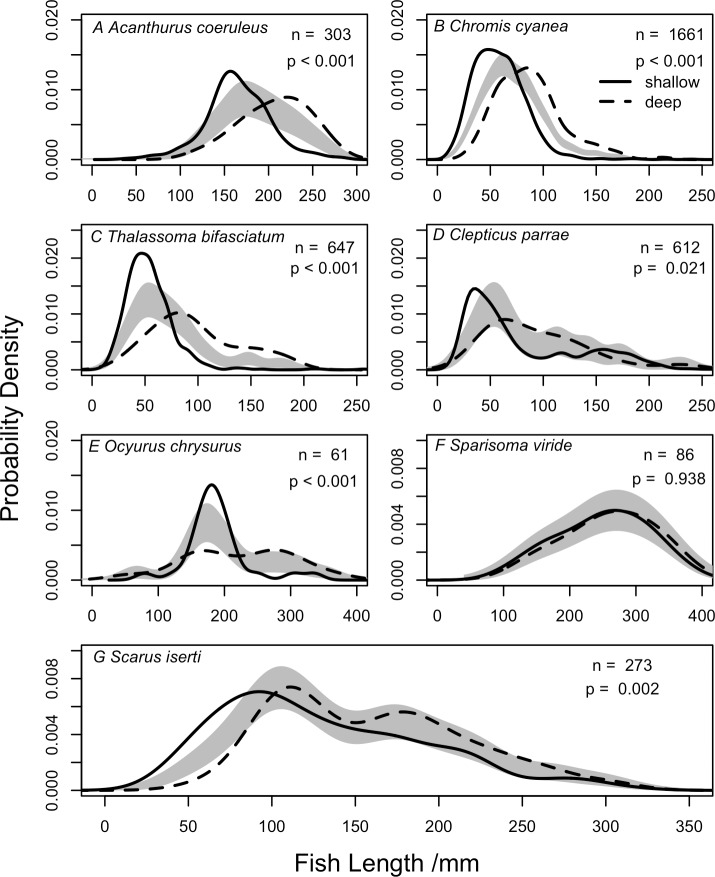
Fig 7. Comparison of kernel density estimates for four fish species between shallow and deep reefs.
Comparisons based on all fish individuals measured on shallow (5 and 15m) and deep reefs (25 and 40m) at all sites. Grey shaded regions represent one standard error either side of the null model, n = number of individual fish measured, p indicates whether the length distributions are significantly different based on permutation tests.

