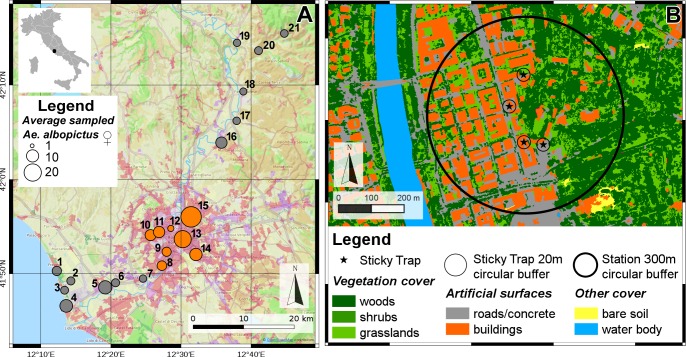
Fig 1. Mean abundance of Aedes albopictus collected along the 70 km-transect encompassing the metropolitan area of Rome.
a) Map showing the weekly mean female abundance during the 18 sampling weeks in the 21 sampling stations (study sites); orange dot = “Metropolitan” site; grey dots = “Sub-Urban-Rural” site. b) Map showing the land cover variables in one of the 21 sampling sites, showing the 300 m-circular buffer calculated from the centroid of the convex hull generated from Sticky Traps (black star) and the 20 m-circular buffer around each Sticky Trap.

