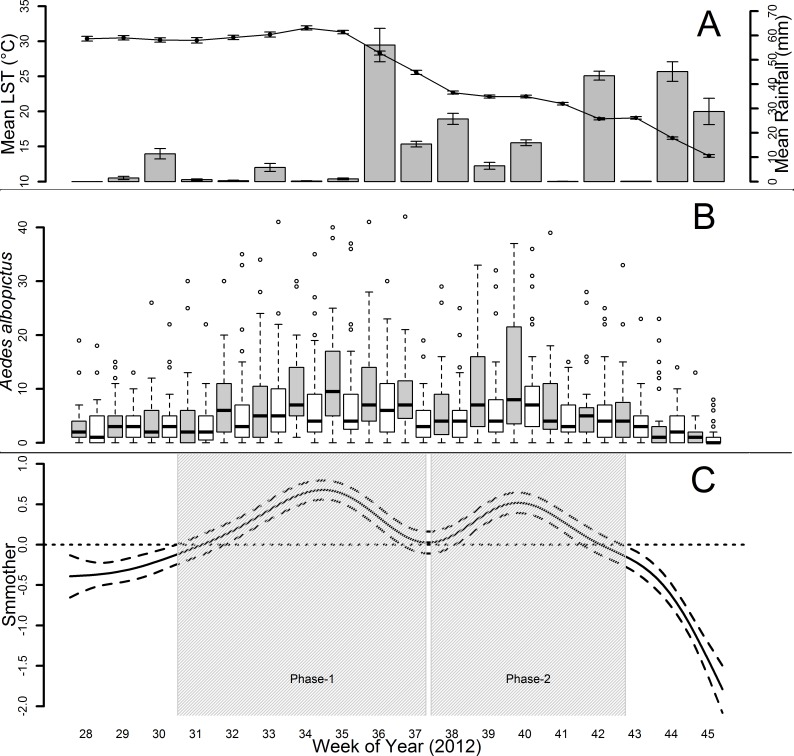
Fig 3. Temporal dynamic of Aedes albopictus females during 18 week-sampling in Rome.
A: Temperature (LST, °C) and Rainfall (mm) observed temporal dynamics. Line graph = T, error bars = 95% confidence intervals, y-axis (left) = mean value of LST/week (Lag 0); bar graph = Rainfall, error bars = 95% confidence intervals, y-axis (right) = mean value of mm of rainfall/week (Lag 0). B: Observed mosquito temporal dynamics. Y-axis = boxplot of mosquito/week in Metropolitan (grey boxes) and Sub-Urban/Rural (white boxes) Environments. Boxes = first and third quartiles (the 25th and 75th percentiles). Line inside the box = median. The upper whisker extends from the boxes to the highest value that is within 1.5 * IQR (inter-quartile range: the distance between the first and third quartiles, so the height of the boxes). The lower whisker extends to the lowest value within 1.5 * IQR. Empty circles = outliers. C: Day of Year smoother (GAMM). Grey areas = phases exploited to investigate the climate drivers of the two peaks of mosquito abundance. X-axis = 18 weeks of collections in 2012.

