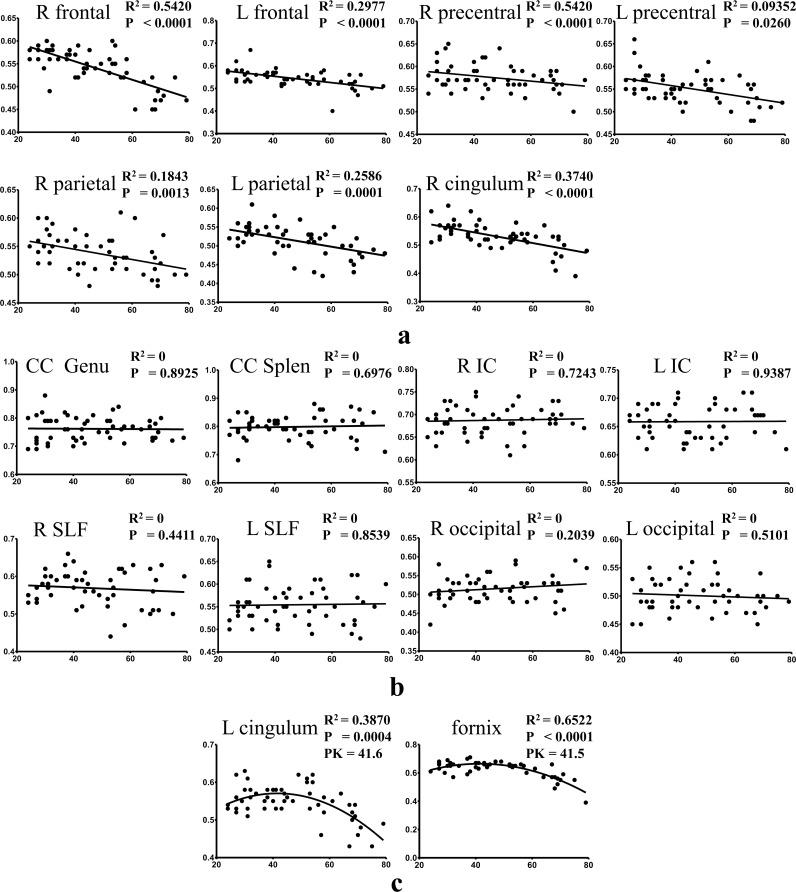
Fig 3. Scatter plots and regression lines for FA as a function of age.
y-axis is for FA values while x-axis is for age. a) Regression with negative slopes; b) Regression with zero slopes; c) Regression using quadratic models. P values in a) and b) are for testing the hypothesis whether slope = 0; P values in c) are for testing the hypothesis whether linear model is better than quadratic model; PK in c) represents peak positions of the quadratic fit.

