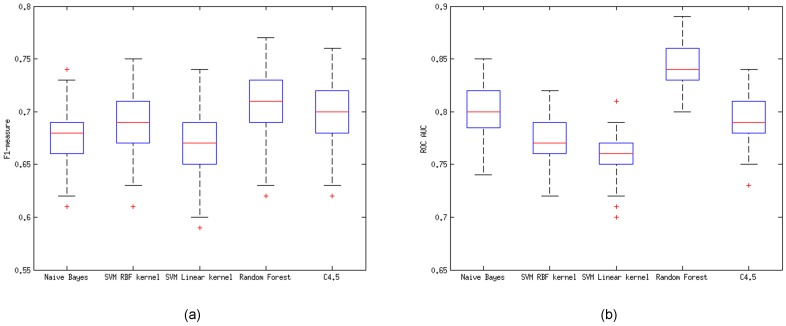
Fig 1. Model selection results across five different machine-learning classifiers, using 10x10-fold cross-validation.
The box indicates the upper/lower quartiles, the horizontal line inside each of them shows the median value, while the dotted crossbars indicate the maximum/minimum values. Both the Fβ = 1 measure (a) and ROC Area Under the Curve (b) comparisons indicate that Random Forest provides the best performance.

