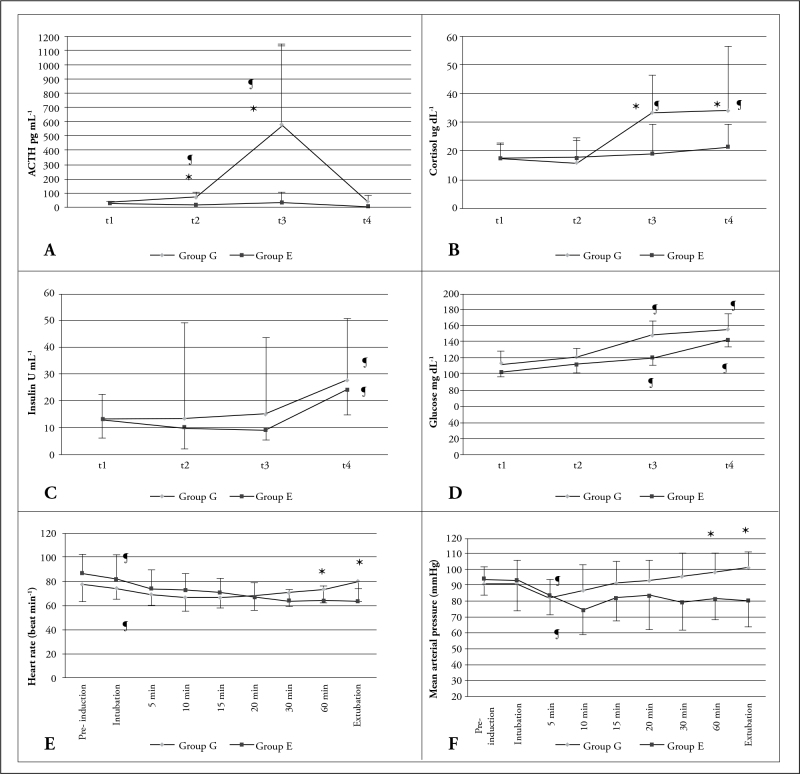
Figure 1.
A–F. Comparison of the general anaesthesia (Group G) and general anaesthesia+epidural anaesthesia (Group E) groups with regard to the adrenocorticotropic hormone (ACTH), cortisol, insulin and glucose levels and the changes in the heart rate (HR) and mean arterial pressure (MAP) over time
A, B: Suppressed ACTH and cortisol levels in Group E.
C, D: Increased insulin and glucose levels in both groups.
E, F: Heart rate (HR) and mean arterial pressure (MAP) values lower than pre-induction values at many measurements performed during the whole monitoring.
t1: pre-induction, t2: post-incision, t3: postoperative 2nd hour, t4: postoperative 24th hour.
¶significant difference compared with pre-induction value, *significant difference between groups
All values in mean±standard deviation

