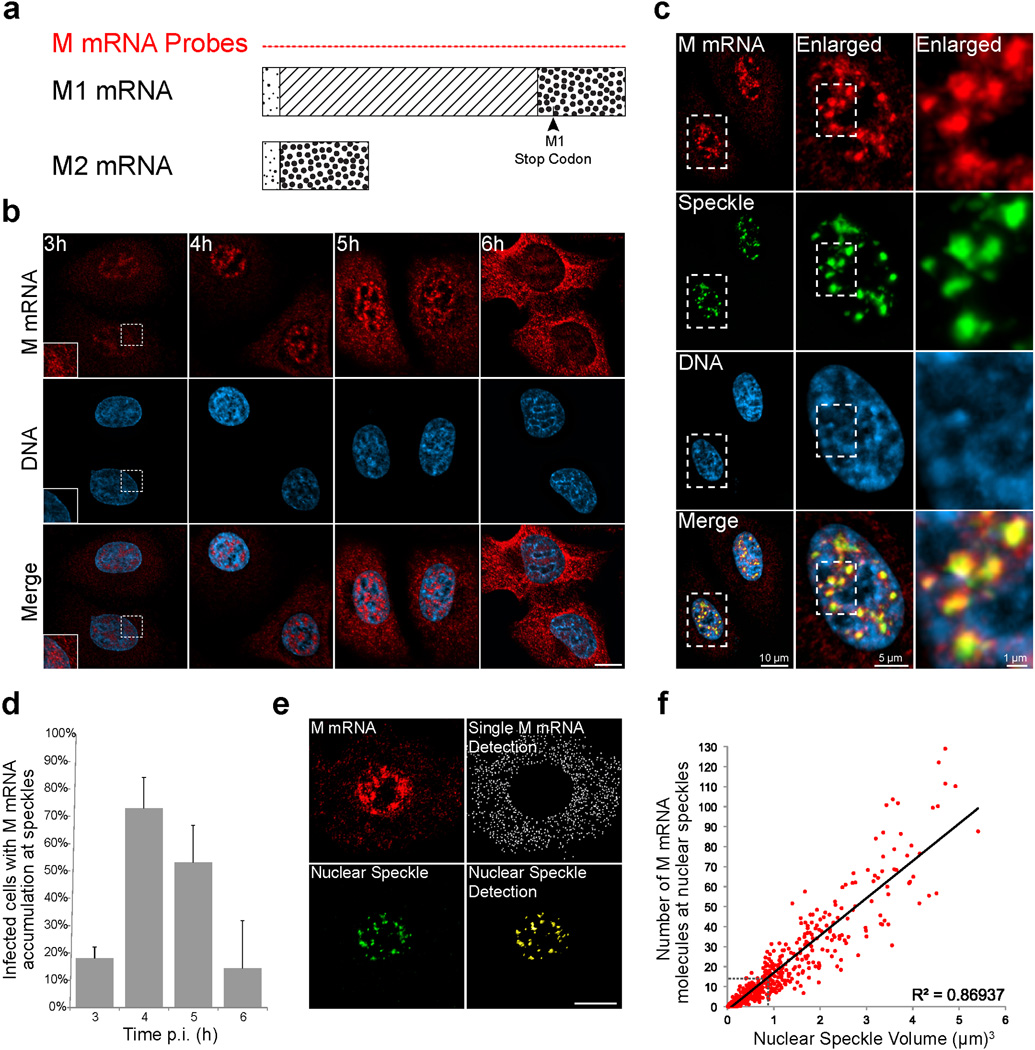
Figure 1. Influenza M mRNA is localized at nuclear speckles.
(a) Schematic representation of M1 and M2 mRNAs. The diagonal lines in M1 mRNA represent an intron that is spliced out to generate M2 mRNA. Forty-six FISH probes labeled with Quasar 570 (M mRNA Probes) that cover the entire M1 and M2 mRNAs were synthesized. (b) These probes monitored the distribution of M mRNA at 3h, 4h, and 6h during A/WSN/33 infection of A549 cells at MOI 10. Inset shows enlargement of an area in the nucleus and cytoplasm. Images are representative of three independent experiments. Scale Bar = 10µm. (c) M mRNA accumulates at nuclear speckles, which were marked by SC35 immunofluorescence staining (Pearson’s Correlation Coefficient between the M mRNA channel and the Speckle channel in the nucleus = 0.72). The squared marked region was enlarged and shown in the middle panel. Further enlargement is shown in the right panel. Images are representative of three independent experiments. (d) The percentage of cells with speckle mRNA accumulation was quantified. Values are percentage mean ± s.d. of at least 99 cells that were counted in three independent experiments for each time point. p.i.- post infection. (e) M mRNA quantification at nuclear speckles. Fluorescent signal emerging from labeled M mRNA transcripts was detected in the cytoplasm (Single M mRNA Detection, white dots) while the M mRNA signal emerging from the nucleus was masked based on Hoechst staining. Nuclear speckles were also marked (Nuclear Speckle Detection, yellow punctate). Images are representative of three independent experiments. Scale Bar = 10µm. (f) Quantification of M mRNA copy number at nuclear speckles marked with SC35 antibody. M mRNA fluorescence intensity sum inside speckles was divided by the average intensity sum of individual cytoplasmic M mRNA transcripts. Cells were infected for 4 h and RNA-FISH was quantified as in e. The number of M mRNA at nuclear speckles was plotted according to the nuclear speckle volume. Dotted lines in the graph depict the average nuclear speckle volume and the corresponding M mRNA copy number. Six hundred and eighty two nuclear speckles were analyzed in 16 cells.

