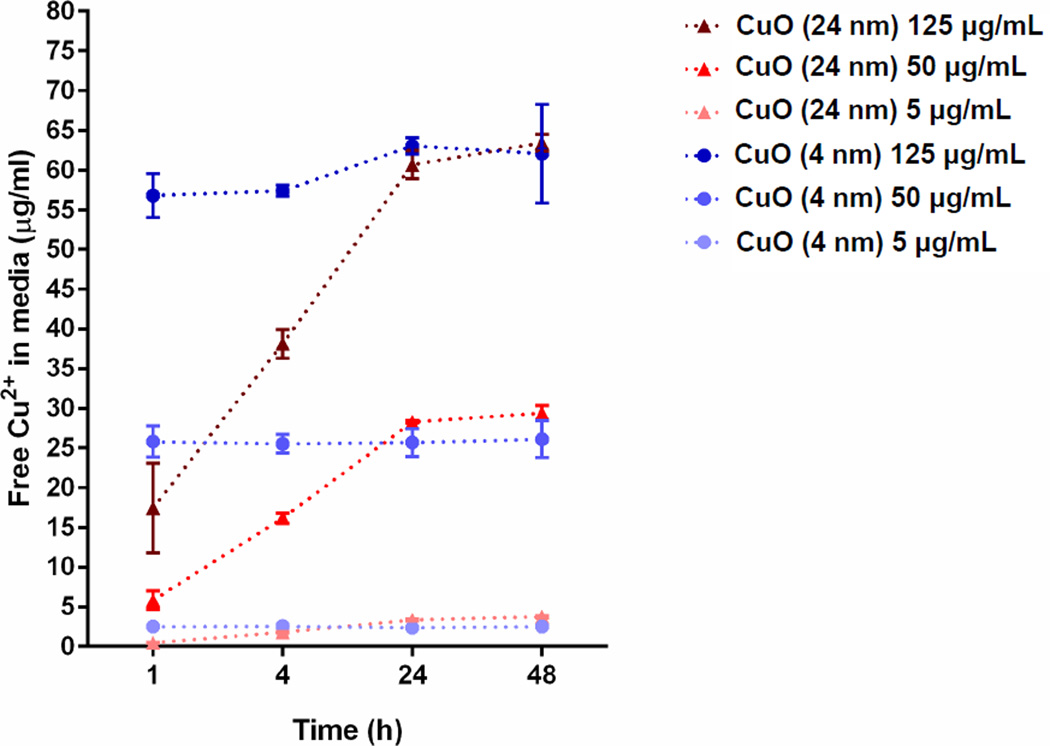
Figure 4. Dissolution of Cu2+ from small and large CuO NPs.
Different concentrations of particles (5, 50 and 125 µg/ml which are equal to 0.06, 0.63 and 1.57 mM, respectively) were sonicated at 40% amplitude for 1 min and then incubated in RPMI-1640 complete media for 1, 4, 24 and 48 h. The data were plotted using free Cu2+ in media against time and expressed as mean ± SD (n = 3).

